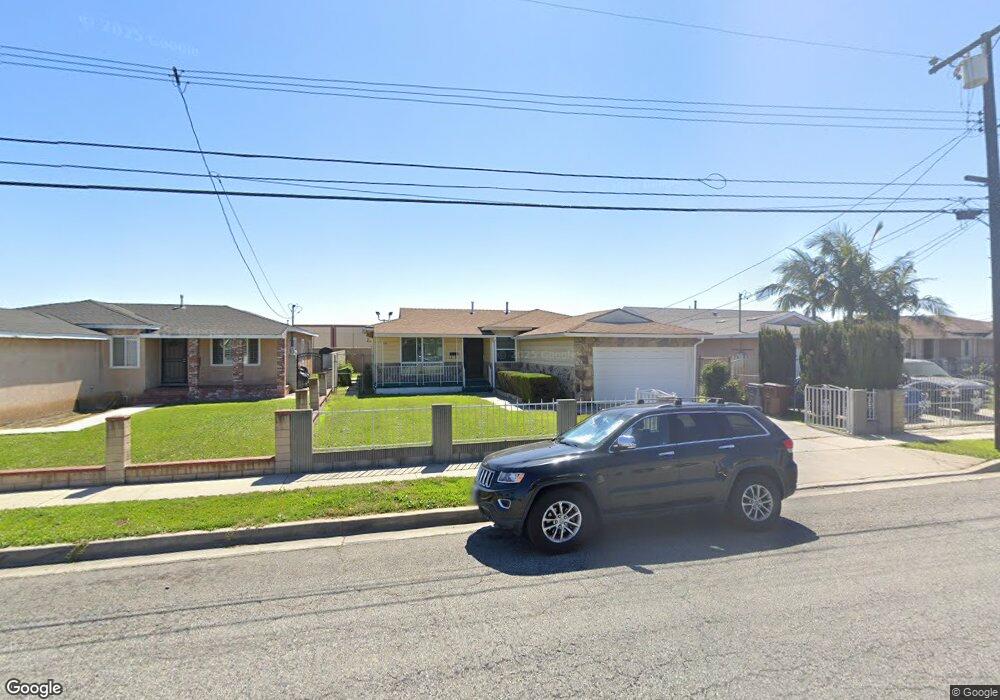
916 W 156th St Compton, CA 90220
Estimated Value: $564,011 - $704,000
3
Beds
1
Bath
1,044
Sq Ft
$602/Sq Ft
Est. Value
About This Home
This home is located at 916 W 156th St, Compton, CA 90220 and is currently estimated at $628,503, approximately $602 per square foot. 916 W 156th St is a home located in Los Angeles County with nearby schools including Laurel Street Elementary School, Benjamin O. Davis Middle School, and Compton High School.
Ownership History
Date
Name
Owned For
Owner Type
Purchase Details
Closed on
Oct 4, 2017
Sold by
Johnson Priscilla A
Bought by
The Priscilla Johnson Revocable Living T
Current Estimated Value
Purchase Details
Closed on
Apr 13, 2012
Sold by
Johnson Priscilla A
Bought by
Johnson Priscilla A
Create a Home Valuation Report for This Property
The Home Valuation Report is an in-depth analysis detailing your home's value as well as a comparison with similar homes in the area
Home Values in the Area
Average Home Value in this Area
Purchase History
| Date | Buyer | Sale Price | Title Company |
|---|---|---|---|
| The Priscilla Johnson Revocable Living T | -- | None Available | |
| Johnson Priscilla A | -- | Ticor Title Company |
Source: Public Records
Tax History
| Year | Tax Paid | Tax Assessment Tax Assessment Total Assessment is a certain percentage of the fair market value that is determined by local assessors to be the total taxable value of land and additions on the property. | Land | Improvement |
|---|---|---|---|---|
| 2025 | $1,424 | $40,708 | $13,694 | $27,014 |
| 2024 | $1,424 | $39,911 | $13,426 | $26,485 |
| 2023 | $1,395 | $39,129 | $13,163 | $25,966 |
| 2022 | $1,025 | $38,362 | $12,905 | $25,457 |
| 2021 | $1,021 | $37,610 | $12,652 | $24,958 |
| 2019 | $4,528 | $36,497 | $12,278 | $24,219 |
| 2018 | $4,443 | $35,783 | $12,038 | $23,745 |
| 2016 | $863 | $34,395 | $11,571 | $22,824 |
| 2015 | $835 | $33,880 | $11,398 | $22,482 |
| 2014 | $831 | $33,217 | $11,175 | $22,042 |
Source: Public Records
Map
Nearby Homes
- 159 S Wilmington Ave Unit F
- 157 S Wilmington Ave Unit I
- 155 S Wilmington Ave Unit C
- 969 W Dhalia St
- 820 W Compton Blvd Unit 17
- 310 S Paulsen Ave
- 485 W Compton Blvd
- 431 S Tajauta Ave
- 623 W Indigo St
- 910 W Palmer St
- 213 N Broadacres Ave
- 653 W Compton Blvd
- 1485 W 154th St
- 1201 S Grandee Ave
- 940 W Brazil St
- 316 N Maie Ave
- 1317 W School St
- 524 W Laurel St
- 533 W Almond St
- 1210 S Grandee Ave
Your Personal Tour Guide
Ask me questions while you tour the home.