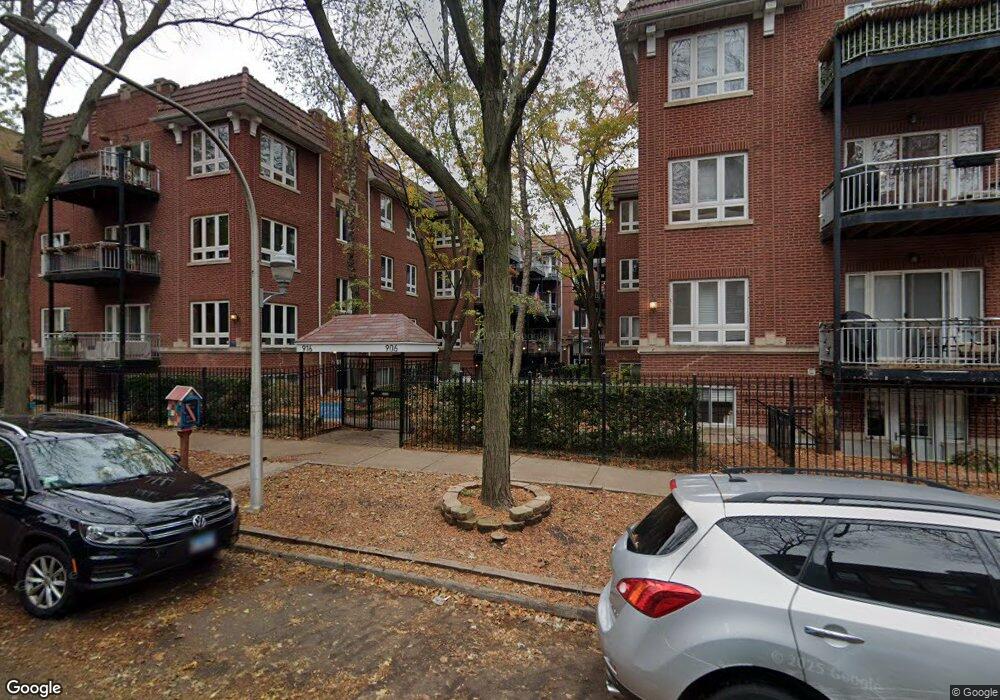
916 W Agatite Ave Unit 2 Chicago, IL 60640
Clarendon Park NeighborhoodEstimated Value: $327,559 - $406,000
2
Beds
2
Baths
1,100
Sq Ft
$321/Sq Ft
Est. Value
About This Home
This home is located at 916 W Agatite Ave Unit 2, Chicago, IL 60640 and is currently estimated at $352,890, approximately $320 per square foot. 916 W Agatite Ave Unit 2 is a home located in Cook County with nearby schools including Brennemann Elementary School, Senn High School, and St Mary Of The Lake School.
Ownership History
Date
Name
Owned For
Owner Type
Purchase Details
Closed on
Jun 6, 2018
Sold by
Harmon Kimberly
Bought by
Kompel Ian A and Glasson Dan W
Current Estimated Value
Home Financials for this Owner
Home Financials are based on the most recent Mortgage that was taken out on this home.
Original Mortgage
$211,850
Outstanding Balance
$183,215
Interest Rate
4.5%
Mortgage Type
New Conventional
Estimated Equity
$169,675
Purchase Details
Closed on
Feb 6, 2010
Sold by
Schuster Scott and Harmon Kimberly
Bought by
Harmon Kimberly
Purchase Details
Closed on
Mar 31, 2005
Sold by
Agatite Vl Development Llc
Bought by
Schuster Scott D and Harmon Kimberly A
Home Financials for this Owner
Home Financials are based on the most recent Mortgage that was taken out on this home.
Original Mortgage
$216,800
Interest Rate
5.71%
Mortgage Type
Unknown
Create a Home Valuation Report for This Property
The Home Valuation Report is an in-depth analysis detailing your home's value as well as a comparison with similar homes in the area
Home Values in the Area
Average Home Value in this Area
Purchase History
| Date | Buyer | Sale Price | Title Company |
|---|---|---|---|
| Kompel Ian A | $223,000 | Chicago Title | |
| Harmon Kimberly | $12,000 | None Available | |
| Schuster Scott D | $271,000 | Multiple |
Source: Public Records
Mortgage History
| Date | Status | Borrower | Loan Amount |
|---|---|---|---|
| Open | Kompel Ian A | $211,850 | |
| Previous Owner | Schuster Scott D | $216,800 | |
| Closed | Schuster Scott D | $26,900 |
Source: Public Records
Tax History Compared to Growth
Tax History
| Year | Tax Paid | Tax Assessment Tax Assessment Total Assessment is a certain percentage of the fair market value that is determined by local assessors to be the total taxable value of land and additions on the property. | Land | Improvement |
|---|---|---|---|---|
| 2024 | $4,575 | $29,479 | $3,950 | $25,529 |
| 2023 | $5,142 | $25,000 | $3,181 | $21,819 |
| 2022 | $5,142 | $25,000 | $3,181 | $21,819 |
| 2021 | $5,027 | $24,999 | $3,181 | $21,818 |
| 2020 | $4,426 | $19,867 | $2,439 | $17,428 |
| 2019 | $4,442 | $22,107 | $2,439 | $19,668 |
| 2018 | $4,367 | $22,107 | $2,439 | $19,668 |
| 2017 | $3,898 | $18,106 | $2,120 | $15,986 |
| 2016 | $3,626 | $18,106 | $2,120 | $15,986 |
| 2015 | $3,318 | $18,106 | $2,120 | $15,986 |
| 2014 | $3,479 | $18,751 | $1,617 | $17,134 |
| 2013 | $3,410 | $18,751 | $1,617 | $17,134 |
Source: Public Records
Map
Nearby Homes
- 844 W Agatite Ave Unit 2W
- 945 W Agatite Ave Unit 2
- 4334 N Dayton St Unit G
- 4350 N Broadway St Unit 311
- 4343 N Clarendon Ave Unit 1113
- 4343 N Clarendon Ave Unit 707
- 4343 N Clarendon Ave Unit 1315
- 4343 N Clarendon Ave Unit 2613
- 4343 N Clarendon Ave Unit 2209
- 4343 N Clarendon Ave Unit 1715
- 4343 N Clarendon Ave Unit 914
- 4320 N Clarendon Ave Unit 2031
- 4240 N Clarendon Ave Unit 309N
- 4240 N Clarendon Ave Unit 200S
- 707 W Junior Terrace Unit 12
- 4144 N Sheridan Rd Unit 407
- 4144 N Sheridan Rd Unit 510
- 4144 N Sheridan Rd Unit 409
- 4250 N Marine Dr Unit 2606
- 4250 N Marine Dr Unit 1235
- 916 W Agatite Ave Unit 9161
- 916 W Agatite Ave Unit 9162
- 916 W Agatite Ave Unit 9163
- 916 W Agatite Ave Unit 916G
- 916 W Agatite Ave Unit G
- 916 W Agatite Ave Unit 1
- 916 W Agatite Ave Unit 3
- 910 W Agatite Ave Unit 9101
- 910 W Agatite Ave Unit 9103
- 910 W Agatite Ave Unit 9102
- 910 W Agatite Ave Unit 2
- 910 W Agatite Ave Unit 1
- 910 W Agatite Ave Unit 3
- 917 W Sunnyside Ave Unit 3N
- 917 W Sunnyside Ave Unit 917S2
- 917 W Sunnyside Ave Unit 917N1
- 917 W Sunnyside Ave Unit 917N3
- 917 W Sunnyside Ave Unit 2S
- 917 W Sunnyside Ave Unit 1W
- 917 W Sunnyside Ave Unit P85