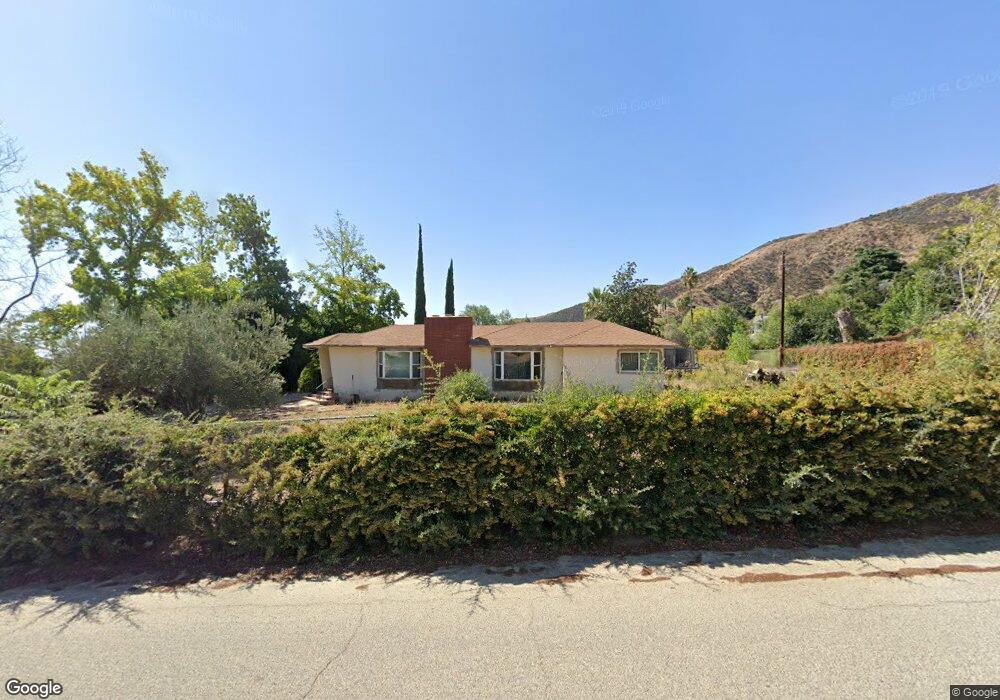
9161 Rancho Dr Cherry Valley, CA 92223
Estimated Value: $589,817 - $739,000
2
Beds
2
Baths
1,928
Sq Ft
$331/Sq Ft
Est. Value
About This Home
This home is located at 9161 Rancho Dr, Cherry Valley, CA 92223 and is currently estimated at $637,954, approximately $330 per square foot. 9161 Rancho Dr is a home located in Riverside County with nearby schools including Brookside Elementary School, Mountain View Middle School, and Beaumont Senior High School.
Ownership History
Date
Name
Owned For
Owner Type
Purchase Details
Closed on
May 5, 2010
Sold by
Fannie Mae
Bought by
Garcia Anthony and Burke Brandee
Current Estimated Value
Home Financials for this Owner
Home Financials are based on the most recent Mortgage that was taken out on this home.
Original Mortgage
$250,381
Outstanding Balance
$166,914
Interest Rate
4.94%
Mortgage Type
FHA
Estimated Equity
$471,040
Purchase Details
Closed on
Jan 4, 2010
Sold by
Luevano Dora L and Luevano Gustavo
Bought by
Federal National Mortgage Association
Purchase Details
Closed on
May 5, 1995
Sold by
Lorenz Elmer W and Lorenz Onie Areta
Bought by
Luevano Gustavo and Luevano Dora L
Home Financials for this Owner
Home Financials are based on the most recent Mortgage that was taken out on this home.
Original Mortgage
$187,680
Interest Rate
8.51%
Mortgage Type
Assumption
Create a Home Valuation Report for This Property
The Home Valuation Report is an in-depth analysis detailing your home's value as well as a comparison with similar homes in the area
Home Values in the Area
Average Home Value in this Area
Purchase History
| Date | Buyer | Sale Price | Title Company |
|---|---|---|---|
| Garcia Anthony | $255,000 | Old Republic Title Company | |
| Federal National Mortgage Association | $296,785 | Landsafe Title | |
| Luevano Gustavo | $184,000 | Commonwealth Land Title Co | |
| Lorenz Elmer W | -- | Commonwealth Land Title Co |
Source: Public Records
Mortgage History
| Date | Status | Borrower | Loan Amount |
|---|---|---|---|
| Open | Garcia Anthony | $250,381 | |
| Previous Owner | Luevano Gustavo | $187,680 |
Source: Public Records
Tax History
| Year | Tax Paid | Tax Assessment Tax Assessment Total Assessment is a certain percentage of the fair market value that is determined by local assessors to be the total taxable value of land and additions on the property. | Land | Improvement |
|---|---|---|---|---|
| 2025 | $4,159 | $329,138 | $70,984 | $258,154 |
| 2023 | $4,159 | $316,360 | $68,229 | $248,131 |
| 2022 | $4,092 | $310,158 | $66,892 | $243,266 |
| 2021 | $4,012 | $304,078 | $65,581 | $238,497 |
| 2020 | $3,970 | $300,961 | $64,909 | $236,052 |
| 2019 | $3,906 | $295,061 | $63,637 | $231,424 |
| 2018 | $3,889 | $289,277 | $62,391 | $226,886 |
| 2017 | $3,827 | $283,606 | $61,168 | $222,438 |
| 2016 | $3,725 | $278,046 | $59,969 | $218,077 |
| 2015 | $3,661 | $273,871 | $59,069 | $214,802 |
| 2014 | $3,662 | $268,509 | $57,913 | $210,596 |
Source: Public Records
Map
Nearby Homes
- 0 Bonita Dr
- 9187 Bonita Dr
- 39380 Oak View Ln
- 9110 Oak Creek Rd
- 39581 Cherry Oak Canyon Rd
- 9575 Oak Glen Rd
- 9710 Mountain View Ave
- 0 Tokay St Unit EV22011453
- 0 Lofty Ln Unit EV24172601
- 39441 Tokay St
- 8321 Overview Ct
- 38608 Pass View Dr
- 9643 Avenida Miravilla
- 0 Cherry Valley Unit EV24091167
- 0 Avenida Miravilla
- 10007 Beaumont Ave
- 1 Avenida Miravilla
- 9870 Nancy Ave
- 39068 Vineland St
- 8705 Apple Tree Ln
- 9111 Rancho Dr
- 9167 Rancho Dr
- 9210 Bonita Dr
- 9184 Bonita Dr
- 9174 Bonita Dr
- 9071 Rancho Dr
- 9221 Rancho Dr
- 9198 Bonita Dr
- 9165 Beauview Dr
- 9060 Bonita Dr
- 9181 Beauview Dr
- 39227 Oak View Ln
- 39235 Oak View Ln
- 9232 Bonita Dr
- 9243 Rancho Dr
- 9254 Bonita Dr
- 9211 Bonita Dr
- 9157 Beauview Dr
- 39290 Cherry Tree Rd
- 9234 Bonita Dr
Your Personal Tour Guide
Ask me questions while you tour the home.