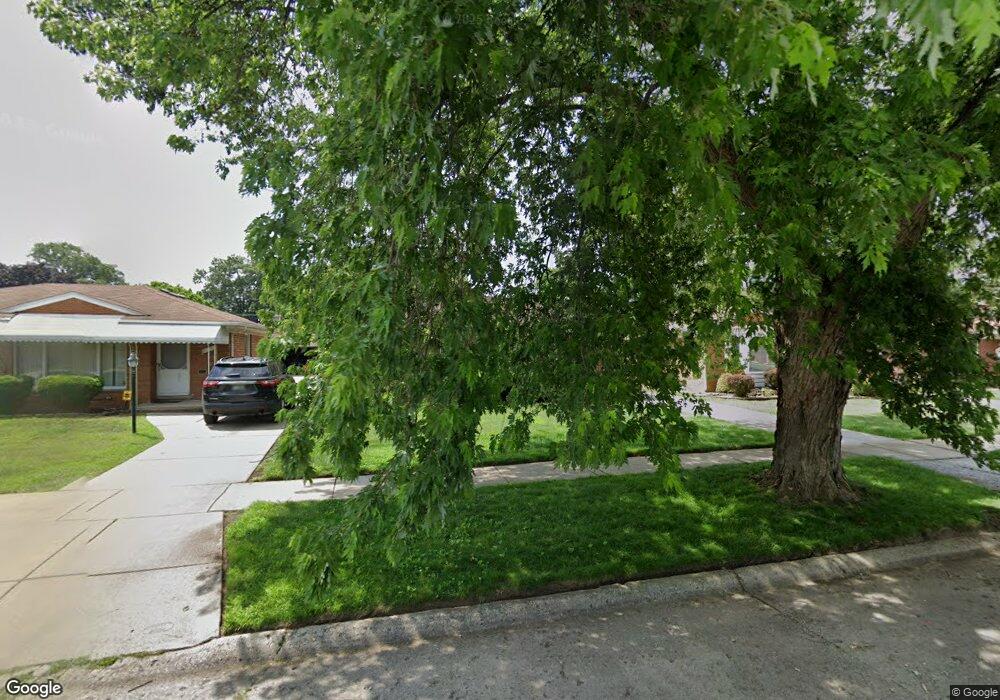
9165 Appleton Redford, MI 48239
Estimated Value: $173,751 - $206,000
3
Beds
1
Bath
1,013
Sq Ft
$190/Sq Ft
Est. Value
About This Home
This home is located at 9165 Appleton, Redford, MI 48239 and is currently estimated at $192,938, approximately $190 per square foot. 9165 Appleton is a home located in Wayne County with nearby schools including John D. Pierce Middle School, Lee M. Thurston High School, and Global Heights Academy.
Ownership History
Date
Name
Owned For
Owner Type
Purchase Details
Closed on
Mar 3, 2016
Sold by
Hawkins Michelle D
Bought by
Mpm Holdings Llc
Current Estimated Value
Purchase Details
Closed on
Nov 13, 2015
Sold by
Wells Fargo Bank National Association
Bought by
Robert Sprader Inc
Purchase Details
Closed on
Sep 3, 2015
Sold by
Hawkins Michelle D and Reed Clarence A
Bought by
Wells Fargo Bank National Association
Purchase Details
Closed on
Jan 9, 2002
Sold by
Chmielewski Janice M
Bought by
Hawkins Michelle D
Create a Home Valuation Report for This Property
The Home Valuation Report is an in-depth analysis detailing your home's value as well as a comparison with similar homes in the area
Home Values in the Area
Average Home Value in this Area
Purchase History
| Date | Buyer | Sale Price | Title Company |
|---|---|---|---|
| Mpm Holdings Llc | -- | Attorney | |
| Robert Sprader Inc | $40,000 | Parks Title Company | |
| Wells Fargo Bank National Association | $51,350 | Attorney | |
| Hawkins Michelle D | $135,000 | -- |
Source: Public Records
Tax History
| Year | Tax Paid | Tax Assessment Tax Assessment Total Assessment is a certain percentage of the fair market value that is determined by local assessors to be the total taxable value of land and additions on the property. | Land | Improvement |
|---|---|---|---|---|
| 2025 | $937 | $80,600 | $0 | $0 |
| 2024 | $911 | $71,800 | $0 | $0 |
| 2023 | $871 | $62,100 | $0 | $0 |
| 2022 | $2,332 | $53,000 | $0 | $0 |
| 2021 | $3,785 | $50,800 | $0 | $0 |
| 2020 | $3,665 | $45,900 | $0 | $0 |
| 2019 | $2,188 | $35,100 | $0 | $0 |
| 2018 | $777 | $29,200 | $0 | $0 |
| 2017 | $3,206 | $26,900 | $0 | $0 |
| 2016 | $1,709 | $25,000 | $0 | $0 |
| 2015 | $2,340 | $23,400 | $0 | $0 |
| 2013 | $2,430 | $24,800 | $0 | $0 |
| 2012 | $1,714 | $27,300 | $6,900 | $20,400 |
Source: Public Records
Map
Nearby Homes