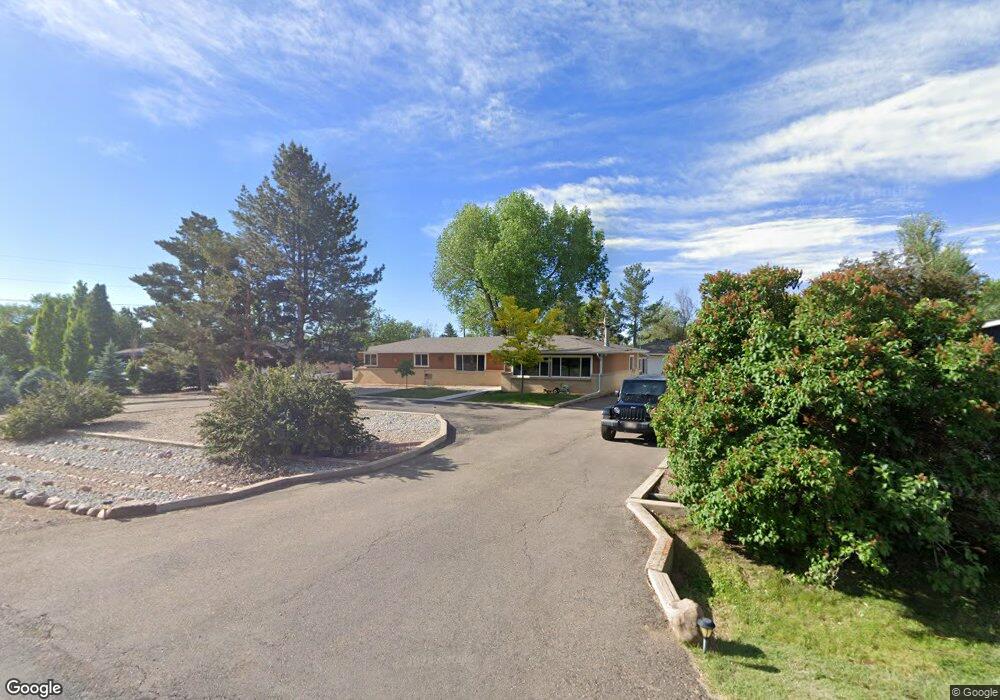
9166 Fleetwood Ave Longmont, CO 80503
Estimated Value: $674,894 - $751,000
3
Beds
2
Baths
1,893
Sq Ft
$374/Sq Ft
Est. Value
About This Home
This home is located at 9166 Fleetwood Ave, Longmont, CO 80503 and is currently estimated at $707,974, approximately $373 per square foot. 9166 Fleetwood Ave is a home located in Boulder County with nearby schools including Hygiene Elementary School, Westview Middle School, and Longmont High School.
Ownership History
Date
Name
Owned For
Owner Type
Purchase Details
Closed on
Jun 27, 2014
Sold by
Kohler Rexanne F
Bought by
Hopman Larry J
Current Estimated Value
Home Financials for this Owner
Home Financials are based on the most recent Mortgage that was taken out on this home.
Original Mortgage
$225,000
Outstanding Balance
$171,831
Interest Rate
4.23%
Mortgage Type
New Conventional
Estimated Equity
$536,143
Purchase Details
Closed on
Mar 25, 2014
Sold by
Acklin Denzil E and Acklin Betty L
Bought by
Kohler Rexanne F
Home Financials for this Owner
Home Financials are based on the most recent Mortgage that was taken out on this home.
Original Mortgage
$252,000
Interest Rate
4.32%
Mortgage Type
Purchase Money Mortgage
Purchase Details
Closed on
Mar 6, 1990
Bought by
Hopman Larry J and Hopman Denise M
Purchase Details
Closed on
Jun 22, 1989
Bought by
Hopman Larry J and Hopman Denise M
Purchase Details
Closed on
Jul 10, 1975
Bought by
Hopman Larry J and Hopman Denise M
Create a Home Valuation Report for This Property
The Home Valuation Report is an in-depth analysis detailing your home's value as well as a comparison with similar homes in the area
Home Values in the Area
Average Home Value in this Area
Purchase History
| Date | Buyer | Sale Price | Title Company |
|---|---|---|---|
| Hopman Larry J | $325,000 | Heritage Title | |
| Kohler Rexanne F | $230,000 | Heritage Title | |
| Hopman Larry J | $110,000 | -- | |
| Hopman Larry J | $101,500 | -- | |
| Hopman Larry J | $38,500 | -- |
Source: Public Records
Mortgage History
| Date | Status | Borrower | Loan Amount |
|---|---|---|---|
| Open | Hopman Larry J | $225,000 | |
| Previous Owner | Kohler Rexanne F | $252,000 |
Source: Public Records
Tax History Compared to Growth
Tax History
| Year | Tax Paid | Tax Assessment Tax Assessment Total Assessment is a certain percentage of the fair market value that is determined by local assessors to be the total taxable value of land and additions on the property. | Land | Improvement |
|---|---|---|---|---|
| 2025 | $4,323 | $49,544 | $13,819 | $35,725 |
| 2024 | $4,323 | $49,544 | $13,819 | $35,725 |
| 2023 | $4,249 | $44,823 | $6,821 | $41,687 |
| 2022 | $3,646 | $36,988 | $6,262 | $30,726 |
| 2021 | $3,653 | $38,052 | $6,442 | $31,610 |
| 2020 | $3,196 | $34,070 | $8,938 | $25,132 |
| 2019 | $3,141 | $34,070 | $8,938 | $25,132 |
| 2018 | $2,446 | $26,640 | $9,000 | $17,640 |
| 2017 | $2,385 | $33,273 | $9,950 | $23,323 |
| 2016 | $2,583 | $28,584 | $10,348 | $18,236 |
| 2015 | $2,368 | $22,949 | $9,950 | $12,999 |
| 2014 | $1,751 | $22,949 | $9,950 | $12,999 |
Source: Public Records
Map
Nearby Homes
- 12682 Anhawa Ave
- 12788 Sheramdi St
- 12884 Anhawa Ave
- 2425 Willow Ln
- 2401 Spindrift Dr Unit 120529205002
- 2912 Lake Park Way
- 2935 Bow Line Place
- 2421 Maplewood Cir W
- 9458 Anhawa Ave
- 2410 Maplewood Cir W
- 2292 Spinnaker Cir
- 3119 Lake Park Way
- 3132 Concord Way
- 3125 Concord Way
- 13205 N 87th St
- 3142 Captains Ln
- 2191 Steele St
- 13168 N 95th St
- 2634 Westlake Ct
- 2078 Goldfinch Ct
- 9148 Fleetwood Ave
- 9184 Fleetwood Ave
- 9133 Jotipa Dr
- 9126 Fleetwood Ave
- 9147 Jotipa Dr
- 9216 Fleetwood Ave
- 9147 Fleetwood Ave
- 9119 Jotipa Dr
- 9159 Jotipa Dr
- 9189 Fleetwood Ave
- 9135 Fleetwood Ave
- 9106 Fleetwood Ave
- 9221 Fleetwood Ave
- 12739 Sheramdi St
- 9127 Fleetwood Ave
- 9165 Jotipa Dr
- 9111 Jotipa Dr
- 9243 Fleetwood Ave
- 9114 Jotipa Dr
- 9194 Aljan Dr