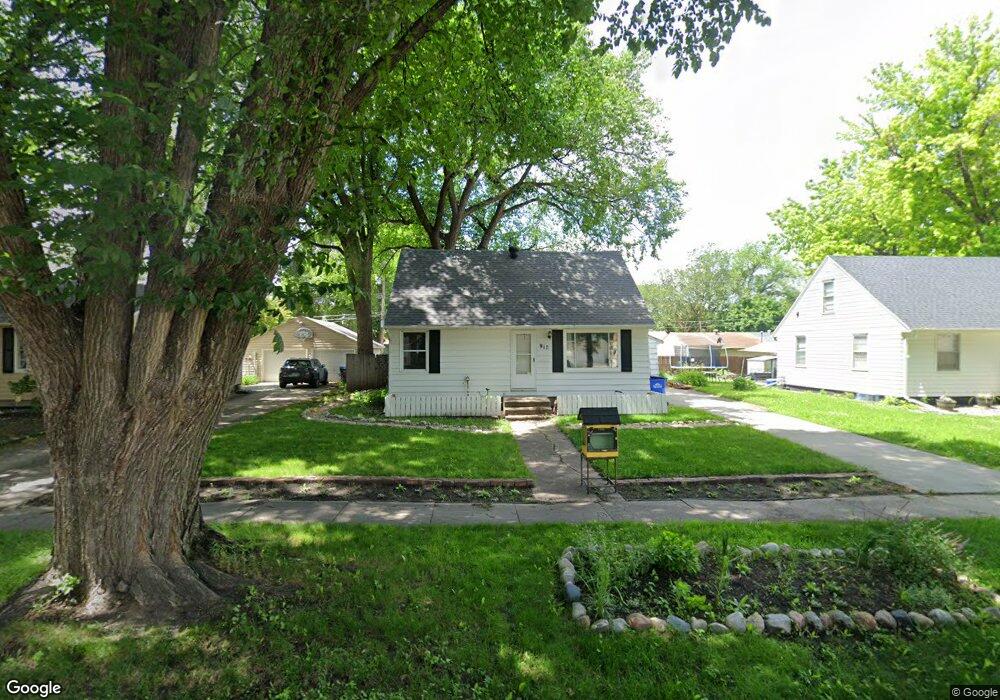
917 20th St S Fargo, ND 58103
Jefferson-Carl NeighborhoodEstimated Value: $226,000 - $251,699
4
Beds
2
Baths
1,817
Sq Ft
$132/Sq Ft
Est. Value
About This Home
This home is located at 917 20th St S, Fargo, ND 58103 and is currently estimated at $239,675, approximately $131 per square foot. 917 20th St S is a home located in Cass County with nearby schools including Jefferson Elementary School, Carl Ben Eielson Middle School, and South High School.
Ownership History
Date
Name
Owned For
Owner Type
Purchase Details
Closed on
Oct 2, 2019
Sold by
Grubb Sylvia Kae
Bought by
Der Stad Sarah Van and Der Stad Alan Van
Current Estimated Value
Home Financials for this Owner
Home Financials are based on the most recent Mortgage that was taken out on this home.
Original Mortgage
$147,155
Outstanding Balance
$128,915
Interest Rate
3.5%
Mortgage Type
New Conventional
Estimated Equity
$110,760
Purchase Details
Closed on
Sep 4, 2015
Sold by
Zimara Russell and Zimara Sabrina E
Bought by
Grubb Sylvia Kae
Home Financials for this Owner
Home Financials are based on the most recent Mortgage that was taken out on this home.
Original Mortgage
$132,905
Interest Rate
3.97%
Mortgage Type
New Conventional
Purchase Details
Closed on
Mar 6, 2009
Sold by
Diehl Sonja P and Diehl Jon
Bought by
Whiting Sabrina E
Home Financials for this Owner
Home Financials are based on the most recent Mortgage that was taken out on this home.
Original Mortgage
$102,509
Interest Rate
5.09%
Mortgage Type
FHA
Create a Home Valuation Report for This Property
The Home Valuation Report is an in-depth analysis detailing your home's value as well as a comparison with similar homes in the area
Home Values in the Area
Average Home Value in this Area
Purchase History
| Date | Buyer | Sale Price | Title Company |
|---|---|---|---|
| Der Stad Sarah Van | $154,900 | Regency Title Inc | |
| Grubb Sylvia Kae | $139,900 | Fargo Title Inc | |
| Whiting Sabrina E | -- | -- |
Source: Public Records
Mortgage History
| Date | Status | Borrower | Loan Amount |
|---|---|---|---|
| Open | Der Stad Sarah Van | $147,155 | |
| Previous Owner | Grubb Sylvia Kae | $132,905 | |
| Previous Owner | Whiting Sabrina E | $102,509 |
Source: Public Records
Tax History Compared to Growth
Tax History
| Year | Tax Paid | Tax Assessment Tax Assessment Total Assessment is a certain percentage of the fair market value that is determined by local assessors to be the total taxable value of land and additions on the property. | Land | Improvement |
|---|---|---|---|---|
| 2024 | $2,664 | $109,300 | $22,150 | $87,150 |
| 2023 | $2,883 | $99,350 | $22,150 | $77,200 |
| 2022 | $2,908 | $98,350 | $22,150 | $76,200 |
| 2021 | $2,578 | $87,800 | $22,150 | $65,650 |
| 2020 | $2,422 | $87,800 | $22,150 | $65,650 |
| 2019 | $2,323 | $83,450 | $13,150 | $70,300 |
| 2018 | $2,264 | $83,450 | $13,150 | $70,300 |
| 2017 | $2,178 | $81,000 | $13,150 | $67,850 |
| 2016 | $1,918 | $78,650 | $13,150 | $65,500 |
| 2015 | $1,679 | $64,200 | $9,000 | $55,200 |
| 2014 | $1,569 | $58,350 | $9,000 | $49,350 |
| 2013 | $1,632 | $58,350 | $9,000 | $49,350 |
Source: Public Records
Map
Nearby Homes
- 818 19th St S
- 814 19th St S
- 1129 22nd St S Unit B09
- 1129 22nd St S Unit B12
- 813 17th St S
- 2009 13th Ave S
- 2013 13th Ave S
- 2209 6th Ave S
- 2126 5th Ave S
- 1301 16 1 2 St S
- 2213 5th Ave S
- 1407 17th St S
- 1524 5th Ave S
- 402 23rd St S
- 1414 10th Ave S
- 1418 11th Ave S
- 1418 12th Ave S
- 1529 4th Ave S
- 2202 15th Ave S
- 1610 2nd Ave S