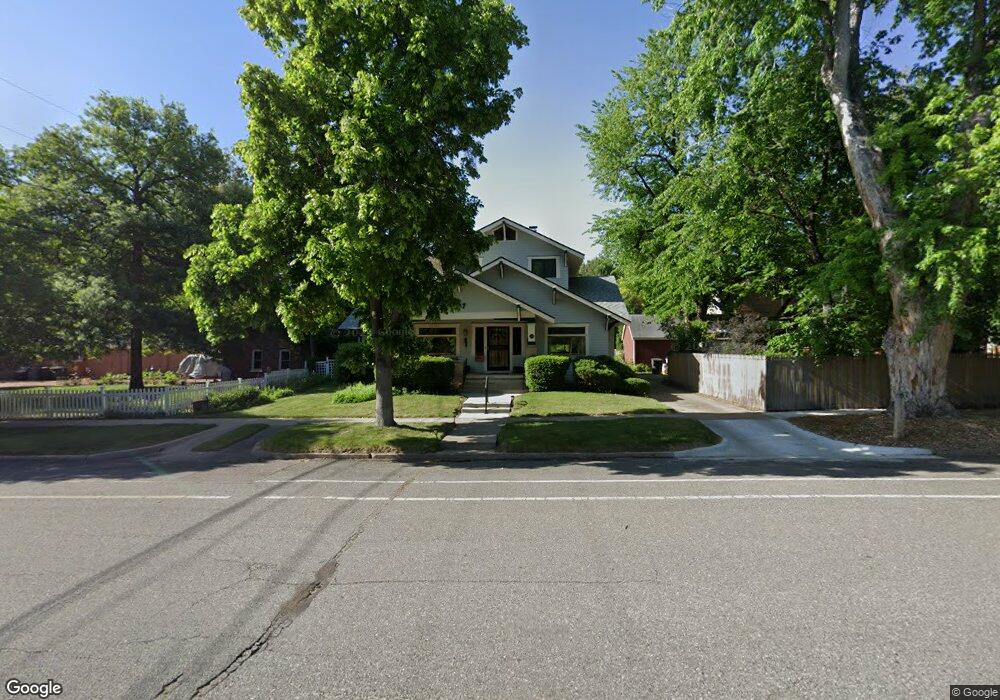
917 4th Ave Longmont, CO 80501
Sunset NeighborhoodEstimated Value: $989,979 - $1,145,000
3
Beds
2
Baths
2,792
Sq Ft
$384/Sq Ft
Est. Value
About This Home
This home is located at 917 4th Ave, Longmont, CO 80501 and is currently estimated at $1,072,745, approximately $384 per square foot. 917 4th Ave is a home located in Boulder County with nearby schools including Central Elementary School, Westview Middle School, and Longmont High School.
Ownership History
Date
Name
Owned For
Owner Type
Purchase Details
Closed on
Dec 6, 2001
Sold by
Piller Cynthia R
Bought by
Piller Cynthia R
Current Estimated Value
Home Financials for this Owner
Home Financials are based on the most recent Mortgage that was taken out on this home.
Original Mortgage
$155,000
Interest Rate
6.52%
Purchase Details
Closed on
Sep 6, 2000
Sold by
Piller Neil E
Bought by
Piller Cynthia R
Purchase Details
Closed on
Sep 9, 1991
Bought by
Piller Cynthia R and Piller Neil E
Purchase Details
Closed on
Oct 30, 1990
Bought by
Piller Cynthia R and Piller Neil E
Purchase Details
Closed on
Nov 16, 1988
Bought by
Piller Cynthia R and Piller Neil E
Purchase Details
Closed on
Jun 22, 1988
Sold by
Grange Sullivan
Bought by
Piller Cynthia R
Create a Home Valuation Report for This Property
The Home Valuation Report is an in-depth analysis detailing your home's value as well as a comparison with similar homes in the area
Home Values in the Area
Average Home Value in this Area
Purchase History
| Date | Buyer | Sale Price | Title Company |
|---|---|---|---|
| Piller Cynthia R | -- | First American Heritage Titl | |
| Piller Cynthia R | -- | -- | |
| Piller Cynthia R | -- | -- | |
| Piller Cynthia R | -- | -- | |
| Piller Cynthia R | -- | -- | |
| Piller Cynthia R | $2,192 | None Available | |
| Piller Cynthia R | $2,200 | -- |
Source: Public Records
Mortgage History
| Date | Status | Borrower | Loan Amount |
|---|---|---|---|
| Previous Owner | Piller Cynthia R | $155,000 |
Source: Public Records
Tax History Compared to Growth
Tax History
| Year | Tax Paid | Tax Assessment Tax Assessment Total Assessment is a certain percentage of the fair market value that is determined by local assessors to be the total taxable value of land and additions on the property. | Land | Improvement |
|---|---|---|---|---|
| 2025 | $4,755 | $58,407 | $11,119 | $47,288 |
| 2024 | $4,755 | $58,407 | $11,119 | $47,288 |
| 2023 | $4,691 | $56,414 | $11,799 | $48,300 |
| 2022 | $4,174 | $49,130 | $8,938 | $40,192 |
| 2021 | $4,228 | $50,543 | $9,195 | $41,348 |
| 2020 | $3,623 | $44,445 | $7,079 | $37,366 |
| 2019 | $3,566 | $44,445 | $7,079 | $37,366 |
| 2018 | $2,831 | $37,008 | $8,136 | $28,872 |
| 2017 | $2,793 | $40,915 | $8,995 | $31,920 |
| 2016 | $3,043 | $39,800 | $9,791 | $30,009 |
| 2015 | $2,900 | $35,024 | $14,169 | $20,855 |
| 2014 | $2,528 | $35,024 | $14,169 | $20,855 |
Source: Public Records
Map
Nearby Homes
- 831 4th Ave
- 409 Terry St Unit D
- 409 Terry St Unit B
- 201 Pratt St
- 219 Terry St
- 1129 2nd Ave
- 207 Lincoln St
- 402 Sherman St
- 400 Emery St Unit 302
- 400 Emery St Unit 208
- 150 Francis St
- 1 Sherman Ct
- 814 Gay St
- 1421 Spruce Ave
- 140 Judson St
- 159 Judson St
- 736 Kimbark St
- 643 Collyer St
- 905 Alta St
- 1202 9th Ave