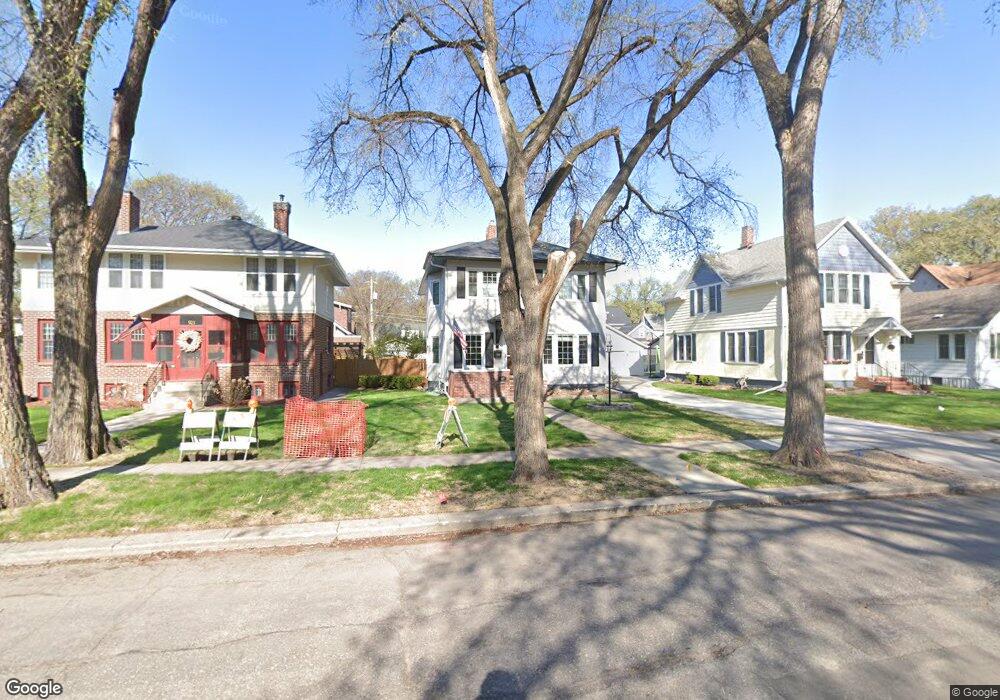
917 7th St S Fargo, ND 58103
Hawthorne NeighborhoodEstimated Value: $483,898 - $572,000
5
Beds
4
Baths
2,778
Sq Ft
$191/Sq Ft
Est. Value
About This Home
This home is located at 917 7th St S, Fargo, ND 58103 and is currently estimated at $530,725, approximately $191 per square foot. 917 7th St S is a home located in Cass County with nearby schools including Clara Barton Elementary School, Ben Franklin Middle School, and South High School.
Ownership History
Date
Name
Owned For
Owner Type
Purchase Details
Closed on
Mar 12, 2015
Sold by
Beede Ronald D and Beede Christine V
Bought by
Mcmanus Ryan P and Ranck Heather A
Current Estimated Value
Home Financials for this Owner
Home Financials are based on the most recent Mortgage that was taken out on this home.
Original Mortgage
$361,000
Outstanding Balance
$276,081
Interest Rate
3.64%
Mortgage Type
New Conventional
Estimated Equity
$254,644
Create a Home Valuation Report for This Property
The Home Valuation Report is an in-depth analysis detailing your home's value as well as a comparison with similar homes in the area
Home Values in the Area
Average Home Value in this Area
Purchase History
| Date | Buyer | Sale Price | Title Company |
|---|---|---|---|
| Mcmanus Ryan P | $380,000 | Regency Title |
Source: Public Records
Mortgage History
| Date | Status | Borrower | Loan Amount |
|---|---|---|---|
| Open | Mcmanus Ryan P | $361,000 |
Source: Public Records
Tax History
| Year | Tax Paid | Tax Assessment Tax Assessment Total Assessment is a certain percentage of the fair market value that is determined by local assessors to be the total taxable value of land and additions on the property. | Land | Improvement |
|---|---|---|---|---|
| 2024 | $5,993 | $240,200 | $22,400 | $217,800 |
| 2023 | $6,459 | $240,200 | $22,400 | $217,800 |
| 2022 | $5,972 | $218,350 | $22,400 | $195,950 |
| 2021 | $5,311 | $197,600 | $22,400 | $175,200 |
| 2020 | $5,260 | $197,600 | $22,400 | $175,200 |
| 2019 | $4,900 | $186,150 | $12,450 | $173,700 |
| 2018 | $4,835 | $186,150 | $12,450 | $173,700 |
| 2017 | $4,644 | $180,750 | $12,450 | $168,300 |
| 2016 | $4,136 | $175,500 | $12,450 | $163,050 |
| 2015 | $3,062 | $121,850 | $9,350 | $112,500 |
| 2014 | $2,855 | $110,750 | $9,350 | $101,400 |
| 2013 | $2,773 | $107,500 | $9,350 | $98,150 |
Source: Public Records
Map
Nearby Homes
- 911 8th St S
- 817 9th St S
- 804 10th St S Unit A4
- 812 10th St S Unit B9
- 1020 6th St S
- 605 7th St S Unit 2
- 502 8th St S Unit 5
- 502 8th St S Unit 1
- 502 8th St S Unit 2
- 502 8th St S Unit 4
- 505 8th St S
- 420 6th Ave S Unit 303
- 601 10th St S
- 515 10th St S
- 326 10th Ave S Unit 2
- 1301 10th St S
- 220 8th St S Unit B2
- 220 8th St S Unit D4
- 1121 4th Ave S
- 1011 14th St S
Your Personal Tour Guide
Ask me questions while you tour the home.