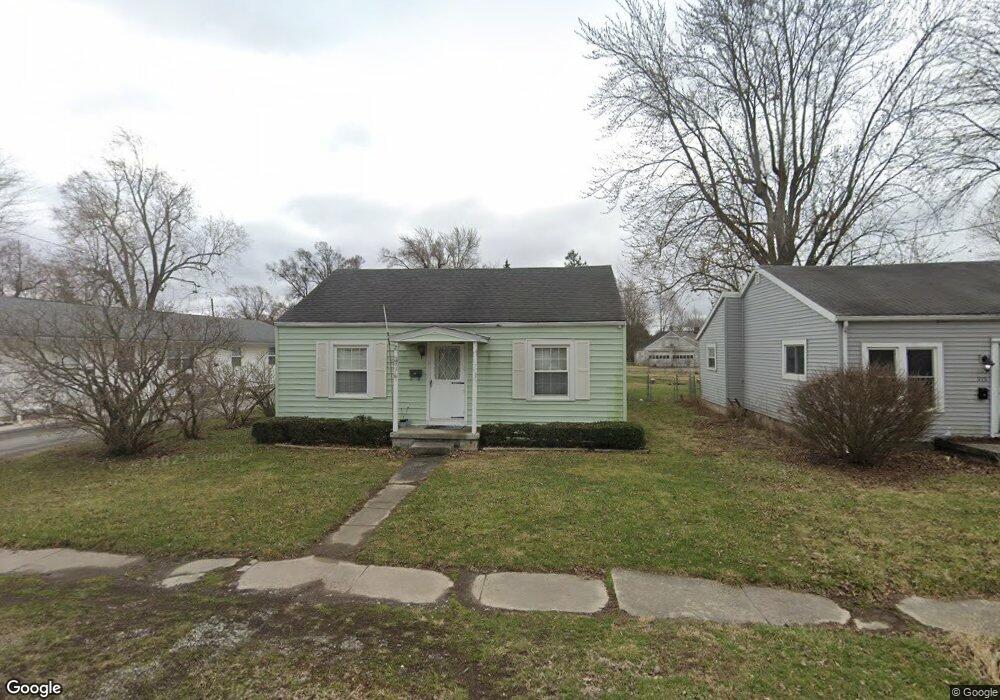
917 Adams St Findlay, OH 45840
Estimated Value: $97,000 - $136,116
2
Beds
1
Bath
936
Sq Ft
$129/Sq Ft
Est. Value
About This Home
This home is located at 917 Adams St, Findlay, OH 45840 and is currently estimated at $120,279, approximately $128 per square foot. 917 Adams St is a home located in Hancock County with nearby schools including Lincoln Elementary School, Donnell Middle School, and Findlay High School.
Ownership History
Date
Name
Owned For
Owner Type
Purchase Details
Closed on
Jul 17, 2003
Sold by
Johnson David and Johnson Linda
Bought by
Johnson Tina M
Current Estimated Value
Home Financials for this Owner
Home Financials are based on the most recent Mortgage that was taken out on this home.
Original Mortgage
$56,000
Interest Rate
4.75%
Mortgage Type
Purchase Money Mortgage
Purchase Details
Closed on
Aug 1, 1994
Sold by
James Larry
Bought by
Johnson David and Johnson Tina
Home Financials for this Owner
Home Financials are based on the most recent Mortgage that was taken out on this home.
Original Mortgage
$59,850
Interest Rate
8.41%
Mortgage Type
New Conventional
Purchase Details
Closed on
Nov 28, 1990
Bought by
James Larry D
Purchase Details
Closed on
Aug 27, 1985
Bought by
Pate Richard B and Pate Tanna K
Create a Home Valuation Report for This Property
The Home Valuation Report is an in-depth analysis detailing your home's value as well as a comparison with similar homes in the area
Home Values in the Area
Average Home Value in this Area
Purchase History
| Date | Buyer | Sale Price | Title Company |
|---|---|---|---|
| Johnson Tina M | -- | Assured Title | |
| Johnson David | $66,500 | -- | |
| James Larry D | $50,100 | -- | |
| Pate Richard B | $39,900 | -- |
Source: Public Records
Mortgage History
| Date | Status | Borrower | Loan Amount |
|---|---|---|---|
| Closed | Johnson Tina M | $56,000 | |
| Closed | Johnson David | $59,850 |
Source: Public Records
Tax History
| Year | Tax Paid | Tax Assessment Tax Assessment Total Assessment is a certain percentage of the fair market value that is determined by local assessors to be the total taxable value of land and additions on the property. | Land | Improvement |
|---|---|---|---|---|
| 2024 | $1,256 | $35,360 | $5,180 | $30,180 |
| 2023 | $1,258 | $35,360 | $5,180 | $30,180 |
| 2022 | $1,254 | $35,360 | $5,180 | $30,180 |
| 2021 | $1,184 | $29,100 | $5,170 | $23,930 |
| 2020 | $1,184 | $29,100 | $5,170 | $23,930 |
| 2019 | $1,160 | $29,100 | $5,170 | $23,930 |
| 2018 | $1,048 | $24,120 | $4,240 | $19,880 |
| 2017 | $1,049 | $24,120 | $4,240 | $19,880 |
| 2016 | $1,043 | $24,120 | $4,240 | $19,880 |
| 2015 | $921 | $21,060 | $4,240 | $16,820 |
| 2014 | $921 | $21,060 | $4,240 | $16,820 |
| 2012 | $928 | $21,060 | $4,240 | $16,820 |
Source: Public Records
Map
Nearby Homes
- 807 W Main Cross St
- 608 W Front St
- 527 W Sandusky St
- 407 Washington St
- 514 Liberty St
- 845 Hurd Ave
- 815 Liberty St
- 860 Hurd Ave
- 412 Lima Ave
- 423 Elm St
- 341 Defiance Ave
- 1113 Hurd Ave
- 239 Thimbleberry Dr
- 125 Cherry St
- 865 S Main St
- 0 Waterford Way Lot 78 Unit 6089639
- 1005 Broad Ave
- 213 Cherry St
- 829 Maple Ave
- 2014 W Sandusky St
Your Personal Tour Guide
Ask me questions while you tour the home.