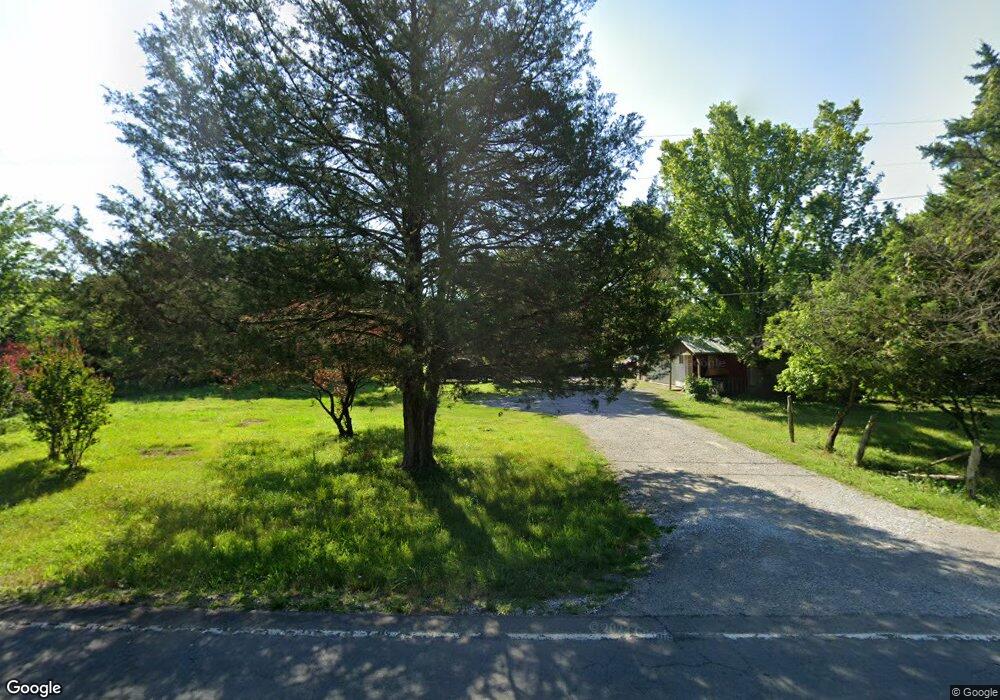
917 Belfast Farmington Rd Lewisburg, TN 37091
Estimated Value: $203,000 - $367,356
--
Bed
1
Bath
1,456
Sq Ft
$206/Sq Ft
Est. Value
About This Home
This home is located at 917 Belfast Farmington Rd, Lewisburg, TN 37091 and is currently estimated at $299,839, approximately $205 per square foot. 917 Belfast Farmington Rd is a home located in Marshall County with nearby schools including Marshall Elementary School, Oak Grove Elementary School, and Westhills Elementary School.
Ownership History
Date
Name
Owned For
Owner Type
Purchase Details
Closed on
Jul 19, 2024
Sold by
Wiles William Paul
Bought by
Thompson Jamie E
Current Estimated Value
Home Financials for this Owner
Home Financials are based on the most recent Mortgage that was taken out on this home.
Original Mortgage
$185,610
Outstanding Balance
$147,356
Interest Rate
6.29%
Mortgage Type
New Conventional
Estimated Equity
$152,483
Purchase Details
Closed on
Sep 20, 2006
Sold by
Harrison Tim R
Bought by
William Wiles
Home Financials for this Owner
Home Financials are based on the most recent Mortgage that was taken out on this home.
Original Mortgage
$49,500
Interest Rate
6.46%
Purchase Details
Closed on
Jul 18, 2003
Sold by
Harrison Janet L
Bought by
Harrison Tim R
Purchase Details
Closed on
Aug 22, 1995
Bought by
Harrison Tim R
Purchase Details
Closed on
Jan 4, 1994
Create a Home Valuation Report for This Property
The Home Valuation Report is an in-depth analysis detailing your home's value as well as a comparison with similar homes in the area
Home Values in the Area
Average Home Value in this Area
Purchase History
| Date | Buyer | Sale Price | Title Company |
|---|---|---|---|
| Thompson Jamie E | $380,000 | First Commerce Title | |
| William Wiles | $55,000 | -- | |
| Harrison Tim R | -- | -- | |
| Harrison Tim R | $32,000 | -- | |
| -- | $14,300 | -- |
Source: Public Records
Mortgage History
| Date | Status | Borrower | Loan Amount |
|---|---|---|---|
| Open | Thompson Jamie E | $185,610 | |
| Previous Owner | -- | $49,500 |
Source: Public Records
Tax History Compared to Growth
Tax History
| Year | Tax Paid | Tax Assessment Tax Assessment Total Assessment is a certain percentage of the fair market value that is determined by local assessors to be the total taxable value of land and additions on the property. | Land | Improvement |
|---|---|---|---|---|
| 2024 | $498 | $27,400 | $8,750 | $18,650 |
| 2023 | $498 | $27,400 | $8,750 | $18,650 |
| 2022 | $498 | $27,400 | $8,750 | $18,650 |
| 2021 | $491 | $17,475 | $4,625 | $12,850 |
| 2020 | $491 | $17,475 | $4,625 | $12,850 |
| 2019 | $447 | $17,475 | $4,625 | $12,850 |
| 2018 | $439 | $15,900 | $4,625 | $11,275 |
| 2017 | $439 | $15,900 | $4,625 | $11,275 |
| 2016 | $481 | $14,950 | $4,600 | $10,350 |
| 2015 | $481 | $14,950 | $4,600 | $10,350 |
| 2014 | $481 | $14,950 | $4,600 | $10,350 |
Source: Public Records
Map
Nearby Homes
- 735 Belfast Farmington Rd
- 1946 Fayetteville Hwy
- 2951 Roy McCollum Rd
- 2373 Phillips Rd
- 2380 Fayetteville Hwy
- 1750 Fayetteville Hwy
- 1664 Fishing Ford Rd
- 0 Fishing Ford Rd Unit 19689699
- 0 Fishing Ford Rd Unit RTC2891288
- 2882 Gold Rd
- 1666 Fayetteville Hwy
- 329 Palmetto Rd
- 2559 Fayetteville Hwy
- 2624 Valley Ln
- 385 Palmetto Rd
- 1655 Grace Ledford Rd
- 0 Finley Beech Unit RTC2945449
- 1511 Finley Beech Rd
- 1600 Alan Perryman Ave
- Ashbury Plan at Spring Valley Estates - Grandview Collection
- 918 Belfast Farmington Rd
- 967 Belfast Farmington Rd
- 873 Belfast Farmington Rd
- 893 Belfast Farmington Rd
- 855 Belfast Farmington Rd
- 998 Belfast Farmington Rd
- 988 Belfast Farmington Rd
- 869 Belfast Farmington Rd
- 843 Belfast Farmington Rd
- 858 Belfast Farmington Rd
- 2318 Finley Beech Rd
- 2334 Finley Beech Rd
- 1015 Belfast Farmington Rd
- 2340 Finley Beech Rd
- 0 Belfast Farmington Rd
- 2309 Finley Beech Rd
- 2200 Finley Beech Rd
- 2321 Finley Beech Rd
- 1045 Belfast Farmington Rd
- 2339 Finley Beech Rd