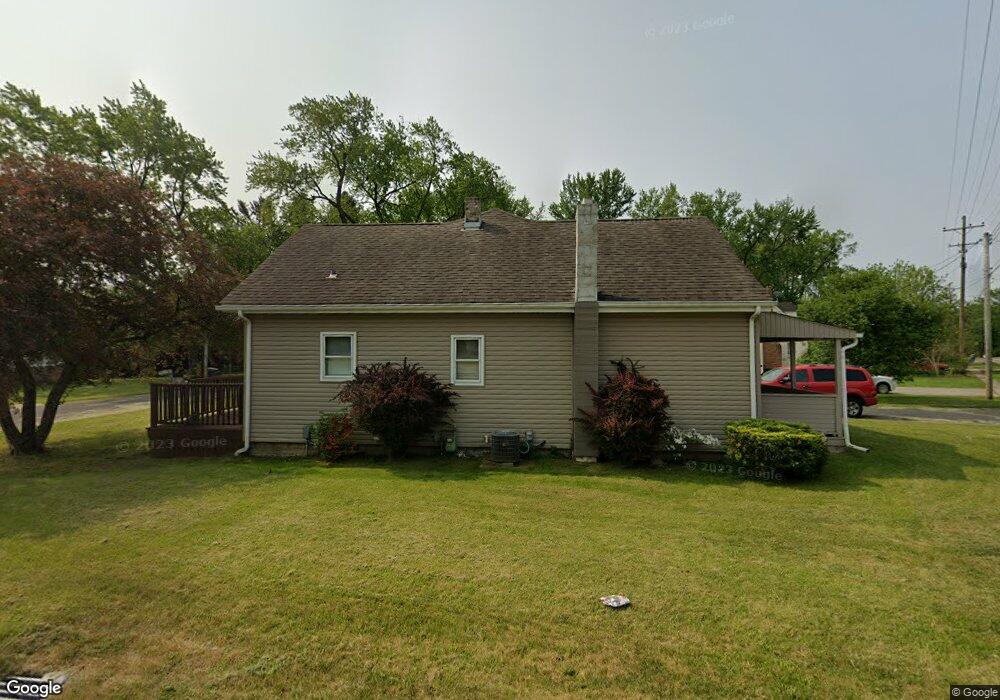
917 Center South Rd Leavittsburg, OH 44430
Estimated Value: $169,000 - $286,655
3
Beds
2
Baths
1,694
Sq Ft
$144/Sq Ft
Est. Value
About This Home
This home is located at 917 Center South Rd, Leavittsburg, OH 44430 and is currently estimated at $243,914, approximately $143 per square foot. 917 Center South Rd is a home located in Trumbull County with nearby schools including LaBrae Intermediate School, Bascom Elementary School, and LaBrae High School.
Ownership History
Date
Name
Owned For
Owner Type
Purchase Details
Closed on
Oct 16, 2002
Sold by
Vance Liberty M and Vance Penny L
Bought by
Nicholas Nicholas B and Nicholas Amy M
Current Estimated Value
Home Financials for this Owner
Home Financials are based on the most recent Mortgage that was taken out on this home.
Original Mortgage
$129,600
Outstanding Balance
$54,651
Interest Rate
6.24%
Mortgage Type
New Conventional
Estimated Equity
$189,263
Purchase Details
Closed on
Aug 16, 2001
Sold by
Horvath Coleman C and Horvath Sheri
Bought by
Vance Liberty M and Vance Penny L
Home Financials for this Owner
Home Financials are based on the most recent Mortgage that was taken out on this home.
Original Mortgage
$130,860
Interest Rate
7.23%
Mortgage Type
New Conventional
Purchase Details
Closed on
Jan 1, 1990
Sold by
Harry Frances and Aponas Frances
Bought by
Frances Harry and Frances Aponas
Create a Home Valuation Report for This Property
The Home Valuation Report is an in-depth analysis detailing your home's value as well as a comparison with similar homes in the area
Home Values in the Area
Average Home Value in this Area
Purchase History
| Date | Buyer | Sale Price | Title Company |
|---|---|---|---|
| Nicholas Nicholas B | $144,000 | Endress Title Company Inc | |
| Vance Liberty M | $137,750 | Endress Title | |
| Frances Harry | -- | -- |
Source: Public Records
Mortgage History
| Date | Status | Borrower | Loan Amount |
|---|---|---|---|
| Open | Vance Liberty M | $129,600 | |
| Closed | Vance Liberty M | $130,860 |
Source: Public Records
Tax History Compared to Growth
Tax History
| Year | Tax Paid | Tax Assessment Tax Assessment Total Assessment is a certain percentage of the fair market value that is determined by local assessors to be the total taxable value of land and additions on the property. | Land | Improvement |
|---|---|---|---|---|
| 2024 | $2,554 | $70,040 | $8,720 | $61,320 |
| 2023 | $2,554 | $70,040 | $8,720 | $61,320 |
| 2022 | $2,322 | $54,850 | $8,050 | $46,800 |
| 2021 | $2,248 | $54,850 | $8,050 | $46,800 |
| 2020 | $2,279 | $54,850 | $8,050 | $46,800 |
| 2019 | $2,197 | $49,250 | $7,460 | $41,790 |
| 2018 | $2,198 | $49,250 | $7,460 | $41,790 |
| 2017 | $2,190 | $49,250 | $7,460 | $41,790 |
| 2016 | $2,135 | $48,480 | $7,460 | $41,020 |
| 2015 | $2,165 | $48,480 | $7,460 | $41,020 |
| 2014 | $2,161 | $48,480 | $7,460 | $41,020 |
| 2013 | $2,144 | $48,480 | $7,460 | $41,020 |
Source: Public Records
Map
Nearby Homes
- 1164 Kale Adams Rd
- 0 Layer Rd
- 245 Diehl Rd S
- 0 Kale Adams Rd SW
- 3984 Warren Ravenna Rd
- 590 Ruth Ave
- VL Risher Rd
- 0 Miller Graber Rd SW
- 819 Braceville Robinson Rd NW
- 3740 W Market St
- 2822 Selkirk Bush Rd SW
- 5173 Palmyra Rd SW
- 4374 Richmond Ave
- 1313 Shavers St SW
- 3366 Eagle Creek Rd
- 4442 La France St
- 0 Palmyra Rd Unit 5011339
- 2931 Randolph St NW
- 2980 Malibu Dr SW
- 722 Arlington Blvd
- 939 Center South Rd
- 939 Center Rd
- 936 Center South Rd
- 885 Center South Rd
- 952 Center South Rd
- 961 Center South Rd
- 962 Center South Rd
- 910 Center South Rd
- 861 Center South Rd
- 880 Center South Rd
- 811 Kale Adams Rd
- 880 Center S
- 843 Center South Rd
- 758 Kale Adams Rd
- 768 Center South Rd
- 839 Center South Rd
- 839 Center South Rd
- 748 Kale Adams Rd
- 817 Kale Adams Rd
- 732 Kale Adams Rd