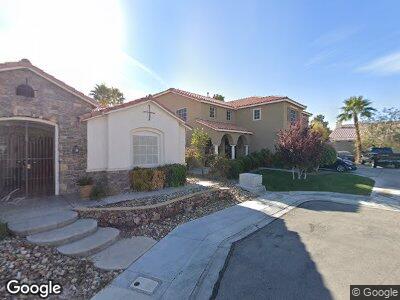
917 Choctaw Ave North Las Vegas, NV 89031
Craig Ranch NeighborhoodEstimated Value: $638,000 - $712,000
5
Beds
3
Baths
3,679
Sq Ft
$185/Sq Ft
Est. Value
About This Home
This home is located at 917 Choctaw Ave, North Las Vegas, NV 89031 and is currently estimated at $679,742, approximately $184 per square foot. 917 Choctaw Ave is a home located in Clark County with nearby schools including Lee Antonello Elementary School, Brian & Teri Cram Middle School, and Legacy High School.
Ownership History
Date
Name
Owned For
Owner Type
Purchase Details
Closed on
Apr 28, 2022
Sold by
Sullivan John F and Sullivan Jill D
Bought by
Sullivan Living Trust
Current Estimated Value
Purchase Details
Closed on
Apr 15, 2004
Sold by
Sullivan John F and Sullivan Jill A D
Bought by
Sullivan John F and Sullivan Jill A D
Home Financials for this Owner
Home Financials are based on the most recent Mortgage that was taken out on this home.
Original Mortgage
$251,300
Interest Rate
5.39%
Mortgage Type
New Conventional
Purchase Details
Closed on
Dec 23, 2002
Sold by
Sullivan John F and Sullivan Jill A
Bought by
Sullivan John F and Sullivan Jill A D
Purchase Details
Closed on
Jul 22, 2002
Sold by
Pardee Homes Of Nevada
Bought by
Sullivan John F and Sullivan Jill A
Home Financials for this Owner
Home Financials are based on the most recent Mortgage that was taken out on this home.
Original Mortgage
$247,000
Interest Rate
6.52%
Create a Home Valuation Report for This Property
The Home Valuation Report is an in-depth analysis detailing your home's value as well as a comparison with similar homes in the area
Home Values in the Area
Average Home Value in this Area
Purchase History
| Date | Buyer | Sale Price | Title Company |
|---|---|---|---|
| Sullivan Living Trust | -- | Jeffrey Burr Ltd | |
| Sullivan John F | -- | United Title Of Nevada | |
| Sullivan John F | -- | -- | |
| Sullivan John F | $277,389 | National Title Company |
Source: Public Records
Mortgage History
| Date | Status | Borrower | Loan Amount |
|---|---|---|---|
| Previous Owner | Sullivan John F | $100,000 | |
| Previous Owner | Sullivan John F | $40,000 | |
| Previous Owner | Sullivan John F | $211,500 | |
| Previous Owner | Sullivan John F | $47,006 | |
| Previous Owner | Sullivan John F | $188,000 | |
| Previous Owner | Sullivan John F | $35,000 | |
| Previous Owner | Sullivan John F | $251,300 | |
| Previous Owner | Sullivan John F | $34,800 | |
| Previous Owner | Sullivan John F | $247,000 |
Source: Public Records
Tax History Compared to Growth
Tax History
| Year | Tax Paid | Tax Assessment Tax Assessment Total Assessment is a certain percentage of the fair market value that is determined by local assessors to be the total taxable value of land and additions on the property. | Land | Improvement |
|---|---|---|---|---|
| 2025 | $3,227 | $195,183 | $54,285 | $140,898 |
| 2024 | $3,134 | $195,183 | $54,285 | $140,898 |
| 2023 | $3,134 | $178,014 | $44,660 | $133,354 |
| 2022 | $3,042 | $160,048 | $38,500 | $121,548 |
| 2021 | $2,954 | $152,585 | $36,960 | $115,625 |
| 2020 | $2,865 | $141,913 | $36,575 | $105,338 |
| 2019 | $2,781 | $134,591 | $30,800 | $103,791 |
| 2018 | $2,732 | $109,418 | $23,100 | $86,318 |
| 2017 | $3,583 | $106,822 | $19,250 | $87,572 |
| 2016 | $2,557 | $100,081 | $17,500 | $82,581 |
| 2015 | $2,552 | $100,757 | $14,000 | $86,757 |
| 2014 | $2,478 | $82,359 | $10,500 | $71,859 |
Source: Public Records
Map
Nearby Homes
- 813 Bluebird Hill Ave
- 1306 Big Tree Ave
- 1003 Dover Glen Dr
- 6128 Casper Sands Ct
- 619 Zalataia Way
- 6525 Bismark Hills St
- 6222 Eliza Ln
- 635 Dry Valley Ave
- 6119 Magic Mesa St
- 825 Great Sky Ct
- 817 Great Sky Ct
- 520 Blackbird Knoll Ct
- 6436 Point Break St
- 1531 Singing Bird Ln
- 1004 Bluebird Ridge Ct
- 5912 Hollowridge Rd
- 1112 Adobe Creek Ct
- 1505 Barrington Oaks St
- 1540 Singing Bird Ln
- 1611 Silent Sunset Ave
- 917 Choctaw Ave
- 913 Choctaw Ave
- 6266 Snow Cactus St
- 6302 Snow Cactus St
- 6260 Snow Cactus St
- 6308 Snow Cactus St
- 920 Bear Gulch Ct
- 918 Choctaw Ave
- 916 Bear Gulch Ct
- 909 Choctaw Ave
- 6254 Snow Cactus St
- 914 Choctaw Ave
- 912 Bear Gulch Ct
- 6312 Snow Cactus St
- 910 Choctaw Ave
- 905 Choctaw Ave
- 1103 Deer Horn Ln
- 1102 Deer Horn Ln
- 908 Bear Gulch Ct
- 906 Choctaw Ave