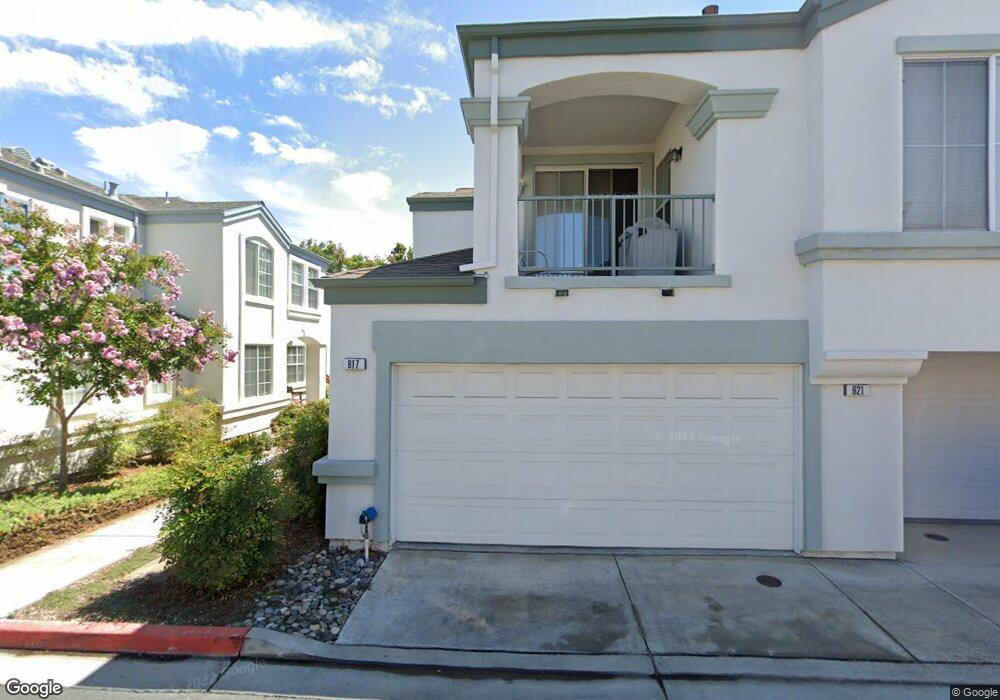
917 Del Avion Ln Unit 431 San Jose, CA 95138
Basking Ridge NeighborhoodEstimated Value: $868,283 - $1,182,000
2
Beds
2
Baths
1,257
Sq Ft
$774/Sq Ft
Est. Value
About This Home
This home is located at 917 Del Avion Ln Unit 431, San Jose, CA 95138 and is currently estimated at $972,571, approximately $773 per square foot. 917 Del Avion Ln Unit 431 is a home located in Santa Clara County with nearby schools including Rita Ledesma Elementary School, Bernal Intermediate School, and Oak Grove High School.
Ownership History
Date
Name
Owned For
Owner Type
Purchase Details
Closed on
Apr 7, 2025
Sold by
Perido Soriano Edward
Bought by
Soriano Living Trust and Soriano
Current Estimated Value
Purchase Details
Closed on
Jun 16, 2020
Sold by
Sorland Edward P and Sorland Thwet Aye
Bought by
Sorland Edward P
Home Financials for this Owner
Home Financials are based on the most recent Mortgage that was taken out on this home.
Original Mortgage
$300,000
Interest Rate
3.2%
Mortgage Type
New Conventional
Purchase Details
Closed on
Sep 27, 2013
Sold by
Soriano Edward P
Bought by
Soriano Edward P
Home Financials for this Owner
Home Financials are based on the most recent Mortgage that was taken out on this home.
Original Mortgage
$340,000
Interest Rate
4.46%
Mortgage Type
New Conventional
Purchase Details
Closed on
Jul 16, 2007
Sold by
Soriano Belinda Sison
Bought by
Soriano Edward P
Home Financials for this Owner
Home Financials are based on the most recent Mortgage that was taken out on this home.
Original Mortgage
$357,000
Interest Rate
6%
Mortgage Type
Purchase Money Mortgage
Purchase Details
Closed on
Jul 10, 2007
Sold by
Weaver Jason T and Weaver Katherine M
Bought by
Soriano Edward P
Home Financials for this Owner
Home Financials are based on the most recent Mortgage that was taken out on this home.
Original Mortgage
$357,000
Interest Rate
6%
Mortgage Type
Purchase Money Mortgage
Purchase Details
Closed on
Aug 12, 2005
Sold by
Weaver Jason T and Weaver George L
Bought by
Weaver Jason T and Weaver Katherine M
Home Financials for this Owner
Home Financials are based on the most recent Mortgage that was taken out on this home.
Original Mortgage
$389,000
Interest Rate
5.62%
Mortgage Type
Purchase Money Mortgage
Purchase Details
Closed on
Mar 8, 2001
Sold by
Weaver Katherine M
Bought by
Weaver Jason T
Home Financials for this Owner
Home Financials are based on the most recent Mortgage that was taken out on this home.
Original Mortgage
$410,000
Interest Rate
7.11%
Mortgage Type
Stand Alone First
Purchase Details
Closed on
Sep 9, 1998
Sold by
Shea Homes Ltd Partnership
Bought by
Kendall James Frederick
Home Financials for this Owner
Home Financials are based on the most recent Mortgage that was taken out on this home.
Original Mortgage
$250,400
Interest Rate
6.79%
Create a Home Valuation Report for This Property
The Home Valuation Report is an in-depth analysis detailing your home's value as well as a comparison with similar homes in the area
Home Values in the Area
Average Home Value in this Area
Purchase History
| Date | Buyer | Sale Price | Title Company |
|---|---|---|---|
| Soriano Living Trust | -- | None Listed On Document | |
| Sorland Edward P | -- | Wfg National Title Company | |
| Soriano Edward P | -- | Chicago Title Company | |
| Soriano Edward P | -- | Alliance Title Company | |
| Soriano Edward P | $557,000 | Alliance Title Company | |
| Weaver Jason T | $194,500 | Ticor Title Company | |
| Weaver Jason T | -- | Old Republic Title Company | |
| Weaver Jason T | $410,000 | Old Republic Title Company | |
| Kendall James Frederick | $264,000 | Alliance Title Company |
Source: Public Records
Mortgage History
| Date | Status | Borrower | Loan Amount |
|---|---|---|---|
| Previous Owner | Sorland Edward P | $300,000 | |
| Previous Owner | Soriano Edward P | $340,000 | |
| Previous Owner | Soriano Edward P | $357,000 | |
| Previous Owner | Weaver Jason T | $389,000 | |
| Previous Owner | Weaver Jason T | $410,000 | |
| Previous Owner | Weaver Jason T | $61,500 | |
| Previous Owner | Kendall James Frederick | $250,400 |
Source: Public Records
Tax History Compared to Growth
Tax History
| Year | Tax Paid | Tax Assessment Tax Assessment Total Assessment is a certain percentage of the fair market value that is determined by local assessors to be the total taxable value of land and additions on the property. | Land | Improvement |
|---|---|---|---|---|
| 2025 | $9,459 | $731,610 | $365,805 | $365,805 |
| 2024 | $9,459 | $717,266 | $358,633 | $358,633 |
| 2023 | $9,334 | $703,202 | $351,601 | $351,601 |
| 2022 | $9,288 | $689,414 | $344,707 | $344,707 |
| 2021 | $9,191 | $675,898 | $337,949 | $337,949 |
| 2020 | $9,050 | $668,968 | $334,484 | $334,484 |
| 2019 | $8,864 | $655,852 | $327,926 | $327,926 |
| 2018 | $8,822 | $642,994 | $321,497 | $321,497 |
| 2017 | $8,117 | $585,000 | $292,500 | $292,500 |
| 2016 | $7,115 | $526,000 | $263,000 | $263,000 |
| 2015 | $6,870 | $512,000 | $256,000 | $256,000 |
| 2014 | $6,284 | $482,000 | $241,000 | $241,000 |
Source: Public Records
Map
Nearby Homes
- 1018 Niguel Ln
- 1021 Chagall Way
- 1075 Esparanza Way
- 1083 Esparanza Way
- 828 Monarch Ln
- 743 Promenade Ln
- 6130 Monterey Rd Unit 289
- 6130 Monterey Rd Unit 9
- 6130 Monterey Rd Unit 159
- 6130 Monterey Rd Unit 260
- 6130 Monterey Rd Unit 316
- 6986 Gregorich Dr Unit C
- 6978 Gregorich Dr Unit F
- 7102 Avenida Rotella
- 7060 Via Anacapa
- 7237 Longhill Way
- 43 Southcreek Ct
- 158 Southsun Ct
- 7394 Basking Ridge Ave
- 82 Essendon Way
- 921 Del Avion Ln Unit 432
- 925 Del Avion Ln Unit 433
- 924 Del Avion Ln Unit 533
- 913 Del Avion Ln Unit 44443
- 905 Del Avion Ln
- 916 Del Avion Ln
- 920 Del Avion Ln Unit 532
- 909 Del Avion Ln
- 912 Del Avion Ln Unit 523
- 869 Basking Ln Unit 23
- 908 Del Avion Ln Unit 522
- 861 Basking Ln
- 904 Del Avion Ln Unit 521
- 865 Basking Ln
- 881 Basking Ln
- 850 Basking Ln
- 857 Basking Ln
- 901 Del Avion Ln Unit 453
- 877 Basking Ln
- 849 Basking Ln Unit 331