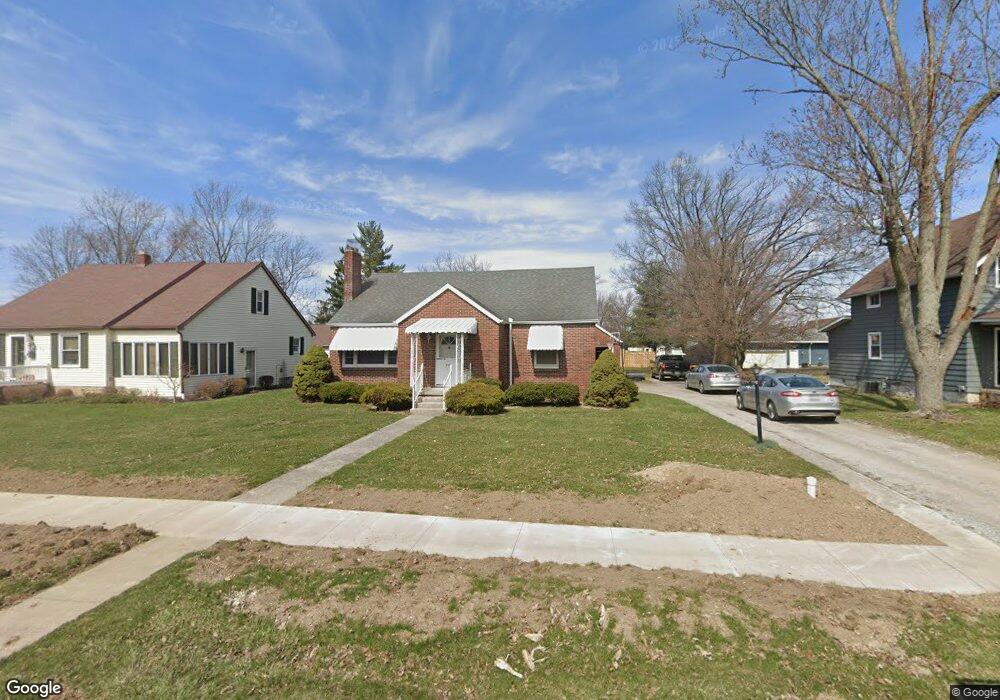
917 E 4th St Ottawa, OH 45875
Estimated Value: $158,000 - $208,000
3
Beds
2
Baths
1,188
Sq Ft
$150/Sq Ft
Est. Value
About This Home
This home is located at 917 E 4th St, Ottawa, OH 45875 and is currently estimated at $178,251, approximately $150 per square foot. 917 E 4th St is a home located in Putnam County with nearby schools including Ottawa-Glandorf High School and Sts. Peter & Paul Catholic School.
Ownership History
Date
Name
Owned For
Owner Type
Purchase Details
Closed on
Dec 20, 2016
Current Estimated Value
Home Financials for this Owner
Home Financials are based on the most recent Mortgage that was taken out on this home.
Interest Rate
4.16%
Purchase Details
Closed on
Feb 29, 2016
Sold by
Lobdell Pamela Kagy and Kagy Eleanor M
Bought by
Pothast Lucas W
Home Financials for this Owner
Home Financials are based on the most recent Mortgage that was taken out on this home.
Original Mortgage
$90,000
Interest Rate
3.57%
Mortgage Type
New Conventional
Create a Home Valuation Report for This Property
The Home Valuation Report is an in-depth analysis detailing your home's value as well as a comparison with similar homes in the area
Home Values in the Area
Average Home Value in this Area
Purchase History
| Date | Buyer | Sale Price | Title Company |
|---|---|---|---|
| -- | $92,790 | -- | |
| Pothast Lucas W | $92,800 | None Available |
Source: Public Records
Mortgage History
| Date | Status | Borrower | Loan Amount |
|---|---|---|---|
| Closed | -- | -- | |
| Previous Owner | Pothast Lucas W | $90,000 |
Source: Public Records
Tax History
| Year | Tax Paid | Tax Assessment Tax Assessment Total Assessment is a certain percentage of the fair market value that is determined by local assessors to be the total taxable value of land and additions on the property. | Land | Improvement |
|---|---|---|---|---|
| 2025 | $2,062 | $47,580 | $5,290 | $42,290 |
| 2024 | $1,779 | $47,580 | $5,290 | $42,290 |
| 2023 | $1,544 | $38,580 | $4,120 | $34,460 |
| 2022 | $1,420 | $38,581 | $4,120 | $34,461 |
| 2021 | $1,406 | $38,010 | $4,120 | $33,890 |
| 2020 | $1,415 | $33,390 | $3,680 | $29,710 |
| 2019 | $1,178 | $31,510 | $4,120 | $27,390 |
| 2018 | $1,158 | $31,510 | $4,120 | $27,390 |
| 2017 | $1,247 | $31,510 | $4,120 | $27,390 |
| 2016 | $1,247 | $33,390 | $3,680 | $29,710 |
| 2015 | $1,256 | $33,390 | $3,680 | $29,710 |
| 2014 | $1,240 | $33,390 | $3,680 | $29,710 |
| 2013 | $887 | $33,390 | $3,680 | $29,710 |
Source: Public Records
Map
Nearby Homes
- 740 E Main St
- 717 E 2nd St
- 238 N Ohio Ave
- 370 S Thomas St
- 1535 E 3rd St
- 715 N Perry St
- 0 Sapphire St Unit 225029940
- 0 Sapphire St Unit 225046385
- 1731 S Agner St
- 1823 S Agner St
- 717 & 717 1/2 & 721 E Third St
- 1997 E Main St
- 309 Oakview Dr
- 113 Crabapple Ln
- 331 Chippewa Dr
- 9896 Road M
- 9410 Road H
- 5666 State Route 224
- 12806 Road K
- 13592 Ohio 694
Your Personal Tour Guide
Ask me questions while you tour the home.