917 Golden West Ct Tehachapi, CA 93561
Estimated Value: $321,000 - $353,346
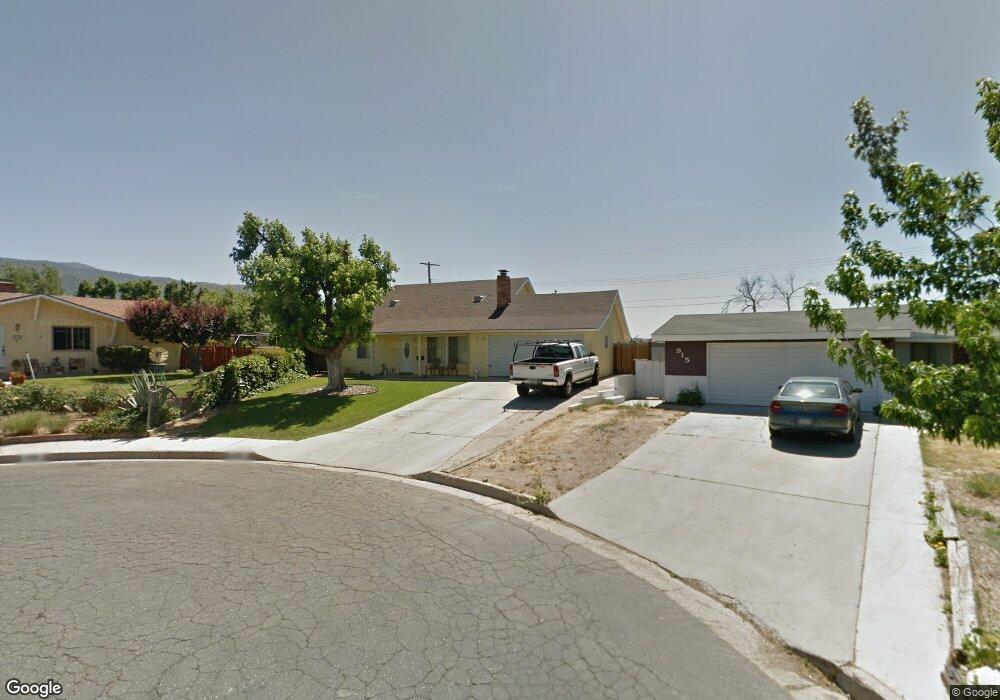
About This Home
This home is located at 917 Golden West Ct, Tehachapi, CA 93561 and is currently estimated at $333,337, approximately $396 per square foot. 917 Golden West Ct is a home located in Kern County with nearby schools including Tompkins Elementary School, Jacobsen Middle School, and Tehachapi High School.
Ownership History
We collect this data history from publicly available records. To have your information removed, we recommend requesting removal directly through your county’s website.
Purchase Details
Home Financials for this Owner
Home Financials are based on the most recent Mortgage that was taken out on this home.Purchase Details
Purchase Details
Home Financials for this Owner
Home Financials are based on the most recent Mortgage that was taken out on this home.Purchase Details
Home Financials for this Owner
Home Financials are based on the most recent Mortgage that was taken out on this home.Purchase Details
Home Financials for this Owner
Home Financials are based on the most recent Mortgage that was taken out on this home.Purchase Details
Home Financials for this Owner
Home Financials are based on the most recent Mortgage that was taken out on this home.Purchase Details
Home Financials for this Owner
Home Financials are based on the most recent Mortgage that was taken out on this home.Purchase Details
Home Financials for this Owner
Home Financials are based on the most recent Mortgage that was taken out on this home.Purchase Details
Purchase Details
Home Values in the Area
Average Home Value in this Area
Purchase History
We collect this data history from publicly available records. To have your information removed, we recommend requesting removal directly through your county’s website.
| Date | Buyer | Sale Price | Title Company |
|---|---|---|---|
| $135,000 | Lsi Title Company Ca | ||
| $177,024 | None Available | ||
| -- | Ticor Title Company | ||
| -- | Ticor Title Company Of Ca | ||
| -- | Title Court Service | ||
| $175,000 | First American Title | ||
| -- | First American Title | ||
| $68,000 | -- | ||
| -- | First American Title Co | ||
| $86,026 | First American Title Ins Co |
Mortgage History
We collect this data history from publicly available records. To have your information removed, we recommend requesting removal directly through your county’s website.
| Date | Status | Borrower | Loan Amount |
|---|---|---|---|
| Previous Owner | $132,554 | ||
| Previous Owner | $202,000 | ||
| Previous Owner | $93,000 | ||
| Previous Owner | $192,000 | ||
| Previous Owner | $148,750 | ||
| Previous Owner | $64,600 |
Tax History
We collect this data history from publicly available records. To have your information removed, we recommend requesting removal directly through your county’s website.
| Year | Tax Paid | Tax Assessment Tax Assessment Total Assessment is a certain percentage of the fair market value that is determined by local assessors to be the total taxable value of land and additions on the property. | Land | Improvement |
|---|---|---|---|---|
| 2025 | $2,160 | $173,829 | $64,379 | $109,450 |
| 2024 | $2,082 | $170,421 | $63,117 | $107,304 |
| 2023 | $2,082 | $167,080 | $61,880 | $105,200 |
| 2022 | $2,058 | $163,805 | $60,667 | $103,138 |
| 2021 | $2,016 | $160,594 | $59,478 | $101,116 |
| 2020 | $2,015 | $158,949 | $58,869 | $100,080 |
| 2019 | $2,015 | $158,949 | $58,869 | $100,080 |
| 2018 | $1,945 | $152,779 | $56,584 | $96,195 |
| 2017 | $1,942 | $149,784 | $55,475 | $94,309 |
| 2016 | $1,891 | $146,848 | $54,388 | $92,460 |
| 2015 | $1,801 | $144,644 | $53,572 | $91,072 |
| 2014 | $1,772 | $141,000 | $35,000 | $106,000 |
Map
- 805 Mulberry St
- 906 Mulberry St
- 705 Elm St
- 770 Tucker Rd
- 600 Las Colinas St
- 704 Elm St
- 1137 Miller Ln Unit 37AR
- 712 Silver Oak Dr
- 0 Applewood Dr
- 420 Maple St
- 0 Black Oak Dr
- 408 Maple St
- 605 Orchard Pkwy
- 212 Artina Ct
- 1300 W Valley Blvd
- 210 Pinon St Unit 11
- 210 Pinon St Unit 18
- 210 Pinon St Unit 4
- 210 Pinon St Unit 1
- 210 Pinon St Unit 6
- 915 Golden West Ct
- 919 Golden Ct W
- 913 Golden West Ct
- 18651 Cherry Ln
- 911 Golden West Ct
- 916 Golden West Ct
- 914 Golden West Ct
- 909 Golden West Ct
- 911 Golden Ct W
- 914 Golden Ct W
- 912 Golden West Ct
- 910 Golden West Ct
- 910 Golden Ct W
- 907 Golden Ct W
- 908 Golden West Ct
- 907 Golden West Ct
- 48732 Cherry Ln
- 48790 Cherry Ln
- 906 Golden West Ct
- 705 Brentwood Dr
Ask me questions while you tour the home.