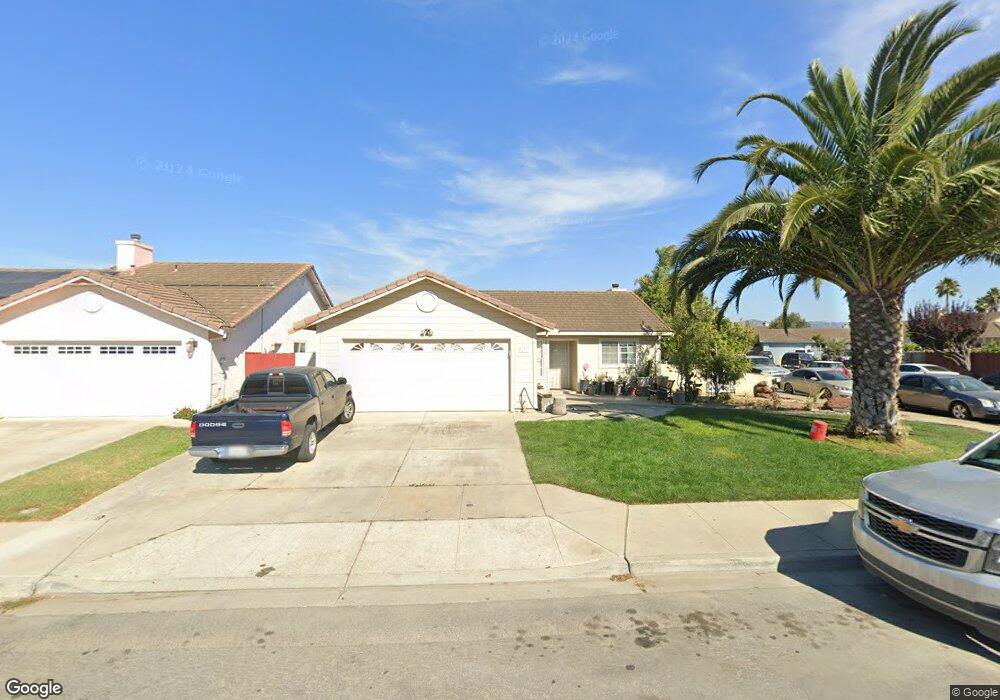
917 La Mancha Way Unit 3 Salinas, CA 93905
East Salinas NeighborhoodEstimated Value: $594,001 - $680,000
3
Beds
2
Baths
1,183
Sq Ft
$543/Sq Ft
Est. Value
About This Home
This home is located at 917 La Mancha Way Unit 3, Salinas, CA 93905 and is currently estimated at $642,000, approximately $542 per square foot. 917 La Mancha Way Unit 3 is a home located in Monterey County with nearby schools including Frank Paul Elementary School, La Paz Middle School, and Alisal High School.
Ownership History
Date
Name
Owned For
Owner Type
Purchase Details
Closed on
Jul 24, 2017
Sold by
Amezcua Judy
Bought by
Amezcua Miguel
Current Estimated Value
Home Financials for this Owner
Home Financials are based on the most recent Mortgage that was taken out on this home.
Original Mortgage
$266,829
Outstanding Balance
$227,404
Interest Rate
4.87%
Mortgage Type
FHA
Estimated Equity
$414,596
Purchase Details
Closed on
Mar 30, 2000
Sold by
Estrada Alfonso A
Bought by
Amezcua Miguel and Amezcua Silvia O
Purchase Details
Closed on
Dec 18, 1995
Sold by
Old Republic Title Company
Bought by
Amezcua Miguel and Amezcua Silvia O
Home Financials for this Owner
Home Financials are based on the most recent Mortgage that was taken out on this home.
Original Mortgage
$123,100
Interest Rate
7.38%
Create a Home Valuation Report for This Property
The Home Valuation Report is an in-depth analysis detailing your home's value as well as a comparison with similar homes in the area
Home Values in the Area
Average Home Value in this Area
Purchase History
| Date | Buyer | Sale Price | Title Company |
|---|---|---|---|
| Amezcua Miguel | -- | Old Republic Title Company | |
| Collazo Miguel Amezcua | $89,000 | Old Republic Title Company | |
| Amezcua Miguel | -- | -- | |
| Amezcua Miguel | $127,000 | Old Republic Title Company |
Source: Public Records
Mortgage History
| Date | Status | Borrower | Loan Amount |
|---|---|---|---|
| Open | Collazo Miguel Amezcua | $266,829 | |
| Previous Owner | Amezcua Miguel | $123,100 |
Source: Public Records
Tax History
| Year | Tax Paid | Tax Assessment Tax Assessment Total Assessment is a certain percentage of the fair market value that is determined by local assessors to be the total taxable value of land and additions on the property. | Land | Improvement |
|---|---|---|---|---|
| 2025 | $2,916 | $210,864 | $99,659 | $111,205 |
| 2024 | $2,916 | $206,730 | $97,705 | $109,025 |
| 2023 | $2,889 | $202,678 | $95,790 | $106,888 |
| 2022 | $2,612 | $198,705 | $93,912 | $104,793 |
| 2021 | $2,609 | $194,810 | $92,071 | $102,739 |
| 2020 | $2,577 | $192,813 | $91,127 | $101,686 |
| 2019 | $2,651 | $189,034 | $89,341 | $99,693 |
| 2018 | $2,504 | $185,329 | $87,590 | $97,739 |
| 2017 | $3,251 | $181,696 | $85,873 | $95,823 |
| 2016 | $3,117 | $178,135 | $84,190 | $93,945 |
| 2015 | $3,301 | $175,460 | $82,926 | $92,534 |
| 2014 | $3,218 | $172,024 | $81,302 | $90,722 |
Source: Public Records
Map
Nearby Homes
- 1046 C St
- 755 Pino Way
- 1544 Saguaro Dr Unit 4
- 1126 Pacific Ave
- 11 Fresa Place
- 1230 Paseo Grande
- 948 Rider Ave
- 1099 Twin Creeks Dr
- 1725 Great Island St
- 18 Hancock Cir
- 10 Rex Cir
- 15 Cheswick Cir
- 933 Acosta Plaza Unit 35
- 11 E Laurel Dr
- 1914 Whitman St
- 11 Hill Cir
- 1849 Bradbury St
- 609 Saint George Dr
- 1918 Bradbury St
- 34 Whitman Cir
- 913 La Mancha Way
- 7 La Mancha Cir Unit 3
- 927 La Mancha Way
- 11 La Mancha Cir Unit 3
- 1310 Bernardo Ave Unit 3
- 1314 Bernardo Ave
- 918 La Mancha Way
- 914 La Mancha Way
- 1320 Bernardo Ave
- 922 La Mancha Way Unit 3
- 8 La Mancha Cir
- 910 La Mancha Way
- 15 La Mancha Cir
- 926 La Mancha Way
- 931 La Mancha Way
- 1324 Bernardo Ave Unit 3
- 906 La Mancha Way Unit 3
- 1328 Bernardo Ave
- 19 La Mancha Cir Unit 3
- 930 La Mancha Way
Your Personal Tour Guide
Ask me questions while you tour the home.