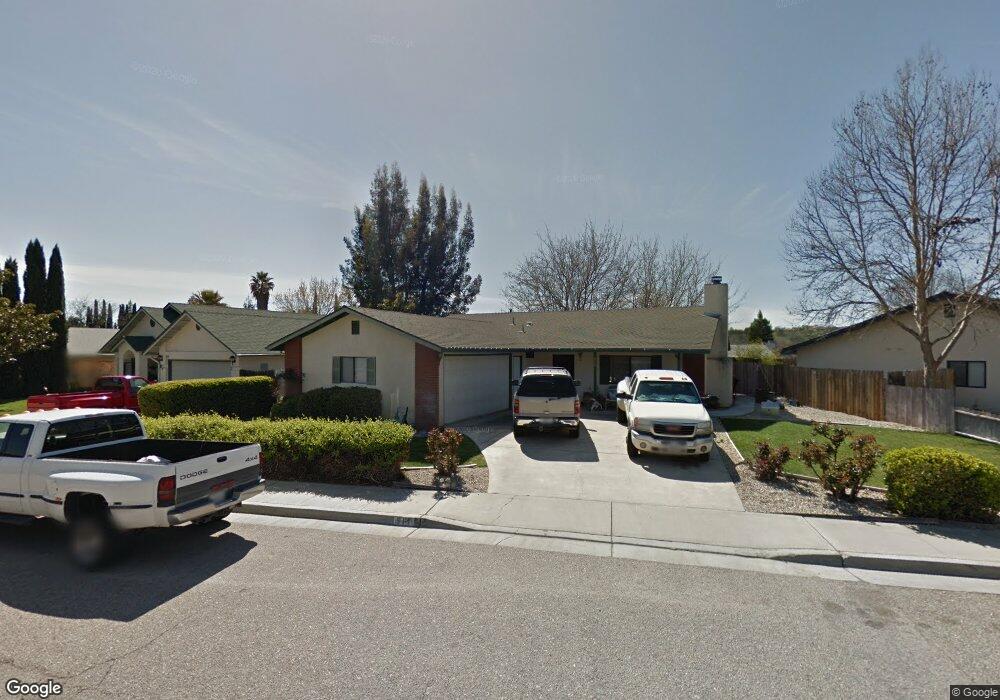
917 Player Ln Paso Robles, CA 93446
Estimated Value: $587,694 - $698,000
3
Beds
2
Baths
1,400
Sq Ft
$460/Sq Ft
Est. Value
About This Home
This home is located at 917 Player Ln, Paso Robles, CA 93446 and is currently estimated at $643,674, approximately $459 per square foot. 917 Player Ln is a home located in San Luis Obispo County with nearby schools including Pat Butler Elementary School, George H. Flamson Middle School, and Paso Robles High School.
Ownership History
Date
Name
Owned For
Owner Type
Purchase Details
Closed on
Apr 17, 1997
Sold by
Brown Robert E and Brown Sharon M
Bought by
Simonin Matthew
Current Estimated Value
Home Financials for this Owner
Home Financials are based on the most recent Mortgage that was taken out on this home.
Original Mortgage
$118,456
Outstanding Balance
$15,409
Interest Rate
7.96%
Mortgage Type
FHA
Estimated Equity
$628,265
Purchase Details
Closed on
Nov 23, 1994
Sold by
Pettit William F and Pettit Socorro S
Bought by
Brown Robert E and Brown Sharon M
Create a Home Valuation Report for This Property
The Home Valuation Report is an in-depth analysis detailing your home's value as well as a comparison with similar homes in the area
Purchase History
| Date | Buyer | Sale Price | Title Company |
|---|---|---|---|
| Simonin Matthew | $119,500 | Chicago Title Co | |
| Brown Robert E | -- | -- |
Source: Public Records
Mortgage History
| Date | Status | Borrower | Loan Amount |
|---|---|---|---|
| Open | Simonin Matthew | $118,456 |
Source: Public Records
Tax History
| Year | Tax Paid | Tax Assessment Tax Assessment Total Assessment is a certain percentage of the fair market value that is determined by local assessors to be the total taxable value of land and additions on the property. | Land | Improvement |
|---|---|---|---|---|
| 2025 | $2,121 | $194,586 | $73,269 | $121,317 |
| 2024 | $2,086 | $190,772 | $71,833 | $118,939 |
| 2023 | $2,086 | $187,032 | $70,425 | $116,607 |
| 2022 | $2,055 | $183,366 | $69,045 | $114,321 |
| 2021 | $2,020 | $179,772 | $67,692 | $112,080 |
| 2020 | $1,993 | $177,929 | $66,998 | $110,931 |
| 2019 | $1,965 | $174,441 | $65,685 | $108,756 |
| 2018 | $1,938 | $171,022 | $64,398 | $106,624 |
| 2017 | $1,822 | $167,670 | $63,136 | $104,534 |
| 2016 | $1,786 | $164,384 | $61,899 | $102,485 |
| 2015 | $1,780 | $161,916 | $60,970 | $100,946 |
| 2014 | $1,718 | $158,745 | $59,776 | $98,969 |
Source: Public Records
Map
Nearby Homes
- 834 Nicklaus St
- 912 Wade Dr
- 1006 Eagle Ct
- 1635 Wade Dr
- 1736 Wade Dr
- 940 Austin Ct
- 795 Angus St
- 911 Saint Ann Dr
- 907 Saint Ann Dr
- 1036 Samantha Dr
- 829 Saint Andrews Cir
- 1107 Patricia Ln
- 470 Kenton Ct
- 448 Morgan Ln
- 1165 Mazzini Rd
- 1166 Mazzini Rd
- 1160 Mazzini Rd
- 1309 Stoney Creek Rd
- 1720 Willowbank Ln
- 250 Santa Bella
Your Personal Tour Guide
Ask me questions while you tour the home.