Estimated Value: $259,000 - $333,000
3
Beds
2
Baths
1,315
Sq Ft
$212/Sq Ft
Est. Value
About This Home
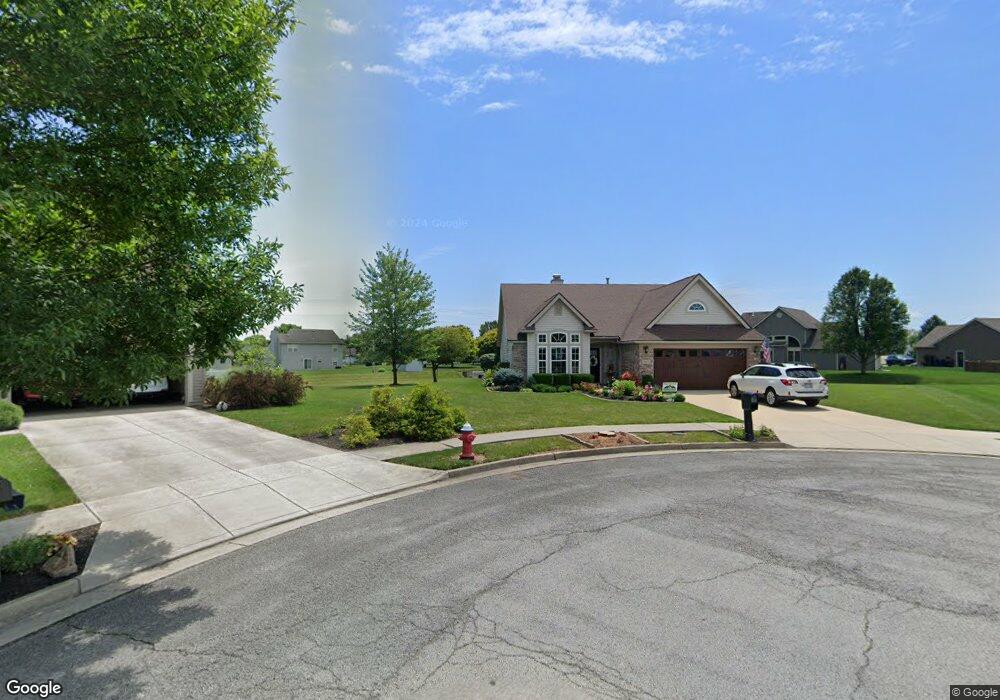
This home is located at 917 Red Deer Trail, Piqua, OH 45356 and is currently estimated at $278,620, approximately $211 per square foot. 917 Red Deer Trail is a home located in Miami County with nearby schools including Washington Primary School, Piqua Junior High School, and Piqua High School.
Ownership History
Date
Name
Owned For
Owner Type
Purchase Details
Closed on
Aug 28, 2015
Sold by
Thompson James R
Bought by
Thompson Jill L
Current Estimated Value
Purchase Details
Closed on
Dec 1, 2005
Sold by
Craycon Homes Inc
Bought by
Rowley Dwane
Create a Home Valuation Report for This Property
The Home Valuation Report is an in-depth analysis detailing your home's value as well as a comparison with similar homes in the area
Home Values in the Area
Average Home Value in this Area
Purchase History
| Date | Buyer | Sale Price | Title Company |
|---|---|---|---|
| Thompson Jill L | -- | Attorney | |
| Rowley Dwane | $146,000 | -- |
Source: Public Records
Mortgage History
| Date | Status | Borrower | Loan Amount |
|---|---|---|---|
| Closed | Rowley Dwane | -- |
Source: Public Records
Tax History Compared to Growth
Tax History
| Year | Tax Paid | Tax Assessment Tax Assessment Total Assessment is a certain percentage of the fair market value that is determined by local assessors to be the total taxable value of land and additions on the property. | Land | Improvement |
|---|---|---|---|---|
| 2024 | $2,473 | $60,170 | $14,110 | $46,060 |
| 2023 | $2,473 | $60,170 | $14,110 | $46,060 |
| 2022 | $2,516 | $60,170 | $14,110 | $46,060 |
| 2021 | $2,391 | $52,290 | $12,250 | $40,040 |
| 2020 | $2,343 | $52,290 | $12,250 | $40,040 |
| 2019 | $2,355 | $52,290 | $12,250 | $40,040 |
| 2018 | $2,152 | $45,610 | $12,250 | $33,360 |
| 2017 | $2,178 | $45,610 | $12,250 | $33,360 |
| 2016 | $2,154 | $45,610 | $12,250 | $33,360 |
| 2015 | $2,204 | $45,610 | $12,250 | $33,360 |
| 2014 | $2,204 | $45,610 | $12,250 | $33,360 |
| 2013 | $2,212 | $45,610 | $12,250 | $33,360 |
Source: Public Records
Map
Nearby Homes
- 513 Spotted Doe Trail
- 1821 Wilshire Dr
- 8490 Bennett Dr
- 1337 Stratford Dr
- 4510 W State Route 185
- 3 Lake Ridge Dr
- 4528 W State Route 185
- 1271 Park Ave
- 1616 Echo Lake Dr
- 210 Lyndhurst Dr
- 1119 Anderson St
- 0 Robert M Davis Pkwy
- 215 Levering Dr
- 1435 Covington Ave
- 817 Washington Ave
- 1200 W High St
- 1115 Madison Ave
- 1026 Lincoln St
- 816 Antler Ct
- 920 Red Deer Trail
- 913 Red Deer Trail
- 813 Antler Ct
- 908 Westview Dr
- 912 Westview Dr
- 904 Westview Dr
- 812 Antler Ct
- 1000 Westview Dr
- 909 Red Deer Trail
- 916 Red Deer Trail
- 900 Westview Dr
- 912 Red Deer Trail
- 809 Antler Ct
- 2104 Fawn Ct
- 1004 Westview Dr
- 808 Antler Ct
- 905 Red Deer Trail
- 808 Westview Dr
- 908 Red Deer Trail