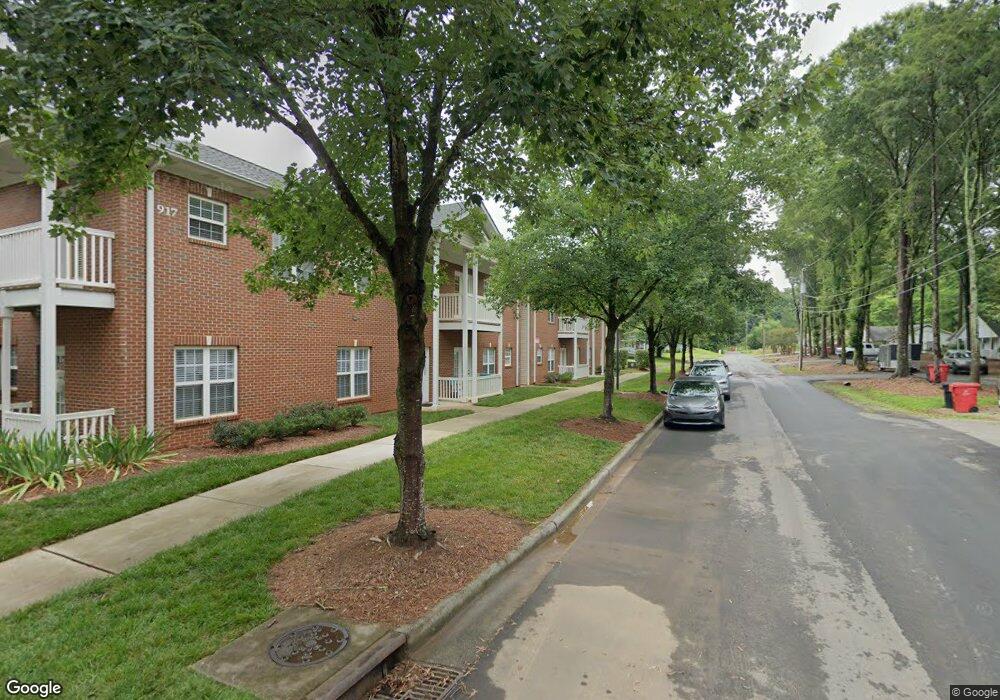
917 Shearer St Unit D10 Davidson, NC 28036
Estimated Value: $229,000 - $257,000
2
Beds
3
Baths
896
Sq Ft
$269/Sq Ft
Est. Value
About This Home
This home is located at 917 Shearer St Unit D10, Davidson, NC 28036 and is currently estimated at $240,793, approximately $268 per square foot. 917 Shearer St Unit D10 is a home located in Mecklenburg County with nearby schools including Davidson Elementary School, William Amos Hough High School, and Davidson Green School.
Ownership History
Date
Name
Owned For
Owner Type
Purchase Details
Closed on
Oct 4, 2023
Sold by
Unknown
Bought by
Garcia Francisco and Garcia Martine
Current Estimated Value
Purchase Details
Closed on
Nov 20, 2017
Sold by
Satterwhite Jacquelyn and Satterwhite William Bradford
Bought by
Montero Sherry Lynn
Home Financials for this Owner
Home Financials are based on the most recent Mortgage that was taken out on this home.
Original Mortgage
$109,615
Interest Rate
3.85%
Mortgage Type
FHA
Purchase Details
Closed on
Mar 31, 2015
Sold by
Boone Mark E and Boone Kristi L
Bought by
Debellis Jacqueline
Home Financials for this Owner
Home Financials are based on the most recent Mortgage that was taken out on this home.
Original Mortgage
$97,500
Interest Rate
4.25%
Mortgage Type
Adjustable Rate Mortgage/ARM
Create a Home Valuation Report for This Property
The Home Valuation Report is an in-depth analysis detailing your home's value as well as a comparison with similar homes in the area
Home Values in the Area
Average Home Value in this Area
Purchase History
| Date | Buyer | Sale Price | Title Company |
|---|---|---|---|
| Garcia Francisco | $240,000 | None Listed On Document | |
| Montero Sherry Lynn | -- | None Available | |
| Debellis Jacqueline | $97,500 | None Available |
Source: Public Records
Mortgage History
| Date | Status | Borrower | Loan Amount |
|---|---|---|---|
| Previous Owner | Montero Sherry Lynn | $109,615 | |
| Previous Owner | Debellis Jacqueline | $97,500 |
Source: Public Records
Tax History
| Year | Tax Paid | Tax Assessment Tax Assessment Total Assessment is a certain percentage of the fair market value that is determined by local assessors to be the total taxable value of land and additions on the property. | Land | Improvement |
|---|---|---|---|---|
| 2025 | $1,517 | $195,873 | -- | $195,873 |
| 2024 | $1,517 | $195,873 | -- | $195,873 |
| 2023 | $1,492 | $195,873 | $0 | $195,873 |
| 2022 | $1,170 | $120,000 | $0 | $120,000 |
| 2021 | $1,188 | $120,000 | $0 | $120,000 |
| 2020 | $1,128 | $120,000 | $0 | $120,000 |
| 2019 | $1,182 | $120,000 | $0 | $120,000 |
| 2018 | $1,146 | $90,200 | $25,200 | $65,000 |
| 2017 | $1,135 | $90,200 | $25,200 | $65,000 |
| 2016 | $1,132 | $90,200 | $25,200 | $65,000 |
| 2015 | $1,128 | $90,200 | $25,200 | $65,000 |
| 2014 | $1,126 | $90,200 | $25,200 | $65,000 |
Source: Public Records
Map
Nearby Homes
- 917 Shearer St Unit 20
- 709 N Main St
- 711 Beaty St
- 235 Alenda Lux Cir
- 546 Amalfi Dr
- 405 Armour St
- 756 Naramore St
- 243 Alenda Lux Cir
- 620 Amalfi Dr
- 240 Alenda Lux Cir
- 738 Naramore St
- 247 Alenda Lux Cir
- 729 Naramore St
- 152 Lavender Bloom Loop
- 559 Midway Lake Rd
- 301 Bridges Farm Rd
- 518 Armour St
- 270 Bridges Farm Rd
- 744 Amalfi Dr
- 748 Amalfi Dr
- 917 Shearer St Unit 3
- 917 Shearer St Unit 19
- 917 Shearer St Unit A1
- 917 Shearer St Unit 5
- 917 Shearer St Unit 18
- 917 Shearer St Unit 14
- 917 Shearer St Unit 15
- 917 Shearer St Unit 16
- 917 Shearer St Unit 4
- 917 Shearer St Unit D8
- 917 Shearer St Unit D7
- 917 Shearer St Unit D9
- 917 Shearer St Unit D12
- 917 Shearer St Unit D11
- 917 Shearer St Unit C4
- 917 Shearer St Unit C3
- 917 Shearer St Unit A2
- 917 Shearer St Unit B2
- 917 Shearer St Unit 9
- 917 Shearer St Unit 7
Your Personal Tour Guide
Ask me questions while you tour the home.