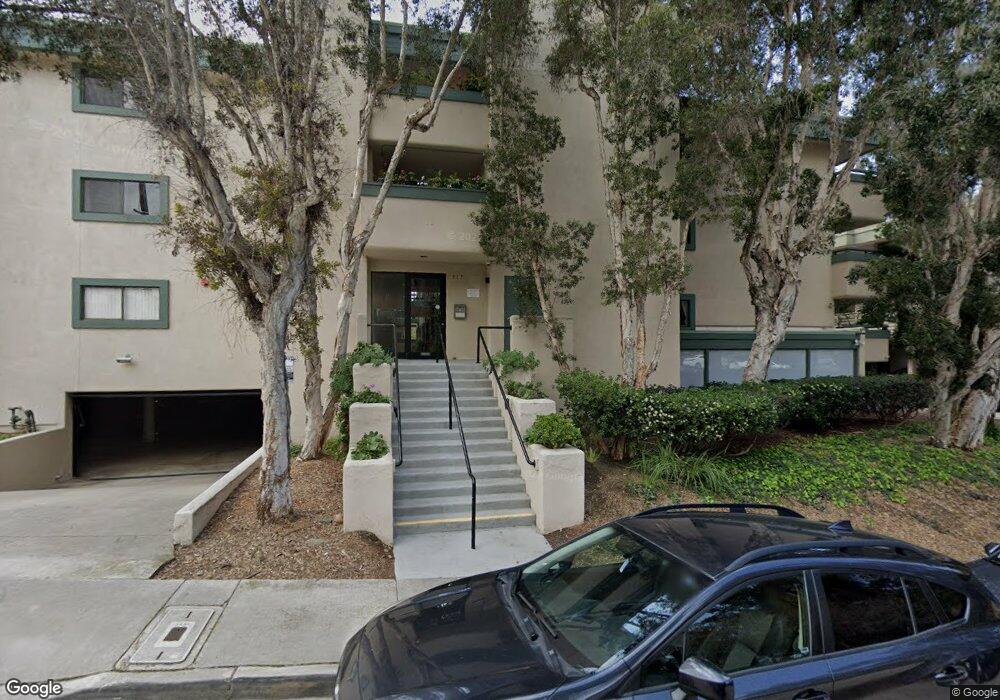
917 Torrance St Unit 18 San Diego, CA 92103
Middletown NeighborhoodEstimated Value: $630,000 - $780,000
2
Beds
2
Baths
1,052
Sq Ft
$656/Sq Ft
Est. Value
About This Home
This home is located at 917 Torrance St Unit 18, San Diego, CA 92103 and is currently estimated at $690,493, approximately $656 per square foot. 917 Torrance St Unit 18 is a home located in San Diego County with nearby schools including Grant K-8, Richard Henry Dana Middle School, and Roosevelt International Middle School.
Ownership History
Date
Name
Owned For
Owner Type
Purchase Details
Closed on
Mar 27, 2009
Sold by
Byrne Patricia E
Bought by
Byrne Patricia E
Current Estimated Value
Purchase Details
Closed on
Sep 1, 2006
Sold by
Byrne Patricia E
Bought by
Byrne Patricia E
Purchase Details
Closed on
Jun 21, 2006
Sold by
Byrne Patricia E
Bought by
Byrne Patricia E
Purchase Details
Closed on
Nov 1, 1993
Sold by
Kendall Patricia E
Bought by
Kendall Patricia E
Home Financials for this Owner
Home Financials are based on the most recent Mortgage that was taken out on this home.
Original Mortgage
$56,500
Interest Rate
6.94%
Purchase Details
Closed on
Sep 17, 1993
Sold by
Kendall Patricia Elaine
Bought by
Kendall Patricia E
Home Financials for this Owner
Home Financials are based on the most recent Mortgage that was taken out on this home.
Original Mortgage
$56,500
Interest Rate
6.94%
Purchase Details
Closed on
May 10, 1991
Create a Home Valuation Report for This Property
The Home Valuation Report is an in-depth analysis detailing your home's value as well as a comparison with similar homes in the area
Home Values in the Area
Average Home Value in this Area
Purchase History
| Date | Buyer | Sale Price | Title Company |
|---|---|---|---|
| Byrne Patricia E | -- | First American Title Lenders | |
| Byrne Patricia E | -- | First American Title Lenders | |
| Byrne Patricia E | -- | First American Title Lenders | |
| Byrne Patricia E | -- | None Available | |
| Byrne Patricia E | -- | New Century Title Co San Die | |
| Byrne Patricia E | -- | New Century Title Company | |
| Kendall Patricia E | -- | -- | |
| Kendall Patricia E | -- | Westland Title | |
| -- | $123,500 | -- |
Source: Public Records
Mortgage History
| Date | Status | Borrower | Loan Amount |
|---|---|---|---|
| Previous Owner | Kendall Patricia E | $56,500 |
Source: Public Records
Tax History Compared to Growth
Tax History
| Year | Tax Paid | Tax Assessment Tax Assessment Total Assessment is a certain percentage of the fair market value that is determined by local assessors to be the total taxable value of land and additions on the property. | Land | Improvement |
|---|---|---|---|---|
| 2025 | $2,714 | $222,721 | $80,436 | $142,285 |
| 2024 | $2,714 | $218,355 | $78,859 | $139,496 |
| 2023 | $2,653 | $214,074 | $77,313 | $136,761 |
| 2022 | $2,583 | $209,878 | $75,798 | $134,080 |
| 2021 | $2,566 | $205,763 | $74,312 | $131,451 |
| 2020 | $2,535 | $203,655 | $73,551 | $130,104 |
| 2019 | $2,490 | $199,662 | $72,109 | $127,553 |
| 2018 | $2,329 | $195,748 | $70,696 | $125,052 |
| 2017 | $2,274 | $191,910 | $69,310 | $122,600 |
| 2016 | $2,237 | $188,148 | $67,951 | $120,197 |
| 2015 | $2,205 | $185,323 | $66,931 | $118,392 |
| 2014 | $2,171 | $181,693 | $65,620 | $116,073 |
Source: Public Records
Map
Nearby Homes
- 3505 Ibis St
- 1235 1239 Lincoln Ave
- 3635 Kite St
- 3448 Goldfinch St
- 3354 Hawk St
- 0 Bush St Unit (35-38) 240005385
- 3467 Reynard Way Unit A
- 301 W Brookes Ave
- 3320 Horton Ave
- 3566 Albatross St
- 1570 Linwood St
- 3206-16 Reynard Way
- 3318-20 Union St
- 3535 Columbia St
- 3531 Columbia St
- 1695 Neale St
- 3963 Eagle St Unit 8
- 3109 Hawk St
- 3972 Jackdaw St
- 3972 Jackdaw St Unit 109
- 917 Torrance St Unit 14
- 917 Torrance St Unit 17
- 917 Torrance St Unit 16
- 917 Torrance St Unit 15
- 917 Torrance St Unit 13
- 917 Torrance St Unit 12
- 917 Torrance St Unit 11
- 917 Torrance St Unit 10
- 917 Torrance St Unit 9
- 917 Torrance St Unit 8
- 917 Torrance St Unit 7
- 917 Torrance St Unit 6
- 917 Torrance St Unit 5
- 917 Torrance St Unit 4
- 917 Torrance St Unit 3
- 917 Torrance St Unit 2
- 917 Torrance St Unit 1
- 917 Torrance St Unit 24
- 917 Torrance St Unit 23
- 917 Torrance St Unit 22