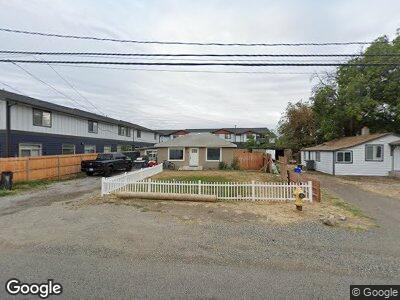
917 W Entiat Ave Unit PRESENTING OFFERS 10 Kennewick, WA 99336
Bridge to Bridge NeighborhoodEstimated Value: $262,000 - $306,000
3
Beds
1
Bath
1,136
Sq Ft
$253/Sq Ft
Est. Value
About This Home
This home is located at 917 W Entiat Ave Unit PRESENTING OFFERS 10, Kennewick, WA 99336 and is currently estimated at $287,750, approximately $253 per square foot. 917 W Entiat Ave Unit PRESENTING OFFERS 10 is a home located in Benton County with nearby schools including Amistad Elementary School, Park Middle School, and Kennewick High School.
Ownership History
Date
Name
Owned For
Owner Type
Purchase Details
Closed on
Apr 8, 2021
Sold by
Carder Jesse A and Garcia Osiris I
Bought by
Luis Dan and Luis Ashley
Current Estimated Value
Home Financials for this Owner
Home Financials are based on the most recent Mortgage that was taken out on this home.
Original Mortgage
$10,000
Outstanding Balance
$9,152
Interest Rate
3.05%
Mortgage Type
Unknown
Estimated Equity
$280,007
Purchase Details
Closed on
Nov 29, 2018
Sold by
Carder Lvannia and Carder Jesse A
Bought by
Carder Jesse A
Home Financials for this Owner
Home Financials are based on the most recent Mortgage that was taken out on this home.
Original Mortgage
$184,300
Interest Rate
4.8%
Mortgage Type
New Conventional
Purchase Details
Closed on
May 4, 2018
Sold by
Deweber Thelma F
Bought by
Rivera Steven H and Rodriguez Myrian J
Create a Home Valuation Report for This Property
The Home Valuation Report is an in-depth analysis detailing your home's value as well as a comparison with similar homes in the area
Home Values in the Area
Average Home Value in this Area
Purchase History
| Date | Buyer | Sale Price | Title Company |
|---|---|---|---|
| Luis Dan | $238,000 | Frontier Title & Escrow Co | |
| Carder Jesse A | -- | Chicago Title | |
| Carder Jesse A | $221,046 | Chicago Title | |
| Rivera Steven H | $90,700 | First American Title |
Source: Public Records
Mortgage History
| Date | Status | Borrower | Loan Amount |
|---|---|---|---|
| Open | Luis Dan | $10,000 | |
| Open | Luis Dan | $223,680 | |
| Previous Owner | Carder Jesse A | $184,300 | |
| Previous Owner | Carder Jesse A | $7,372 |
Source: Public Records
Tax History Compared to Growth
Tax History
| Year | Tax Paid | Tax Assessment Tax Assessment Total Assessment is a certain percentage of the fair market value that is determined by local assessors to be the total taxable value of land and additions on the property. | Land | Improvement |
|---|---|---|---|---|
| 2024 | $2,066 | $242,040 | $70,000 | $172,040 |
| 2023 | $2,066 | $219,100 | $70,000 | $149,100 |
| 2022 | $1,823 | $184,690 | $70,000 | $114,690 |
| 2021 | $1,753 | $158,880 | $40,000 | $118,880 |
| 2020 | $1,818 | $149,690 | $22,000 | $127,690 |
| 2019 | $1,134 | $149,690 | $22,000 | $127,690 |
| 2018 | $1,152 | $86,240 | $22,000 | $64,240 |
| 2017 | $1,165 | $69,870 | $22,000 | $47,870 |
| 2016 | $1,125 | $69,870 | $22,000 | $47,870 |
| 2015 | $1,141 | $78,240 | $15,000 | $63,240 |
| 2014 | -- | $78,240 | $15,000 | $63,240 |
| 2013 | -- | $78,240 | $15,000 | $63,240 |
Source: Public Records
Map
Nearby Homes
- 514 N Kent Place
- 502 N Lyle St
- 522 N Kent Place
- 508 N Hartford St
- 3051 Southgate Way
- 722 W Albany Ave
- 709 W Albany Ave
- 1110 W 1st Ave
- 2 N Palouse St
- 411 W 1st Ave
- 217 S Quincy St
- 214 S Quincy St
- 218 S Quincy St
- 503 N Underwood St
- 2003 W Canal Dr
- 2018 W 2nd Ave
- 200 N Underwood St
- 2101 W Kennewick Ave
- 2009 W 3rd Ave
- 2214 W Clearwater Ave
- 917 W Entiat Ave Unit PRESENTING OFFERS 10
- 917 W Entiat Ave Unit Come see this fully
- 917 W Entiat Ave
- 919 W Entiat Ave
- 911 W Entiat Ave
- 925 W Entiat Ave
- 910 W Entiat Ave
- 920 W Entiat Ave
- 907 W Entiat Ave
- 506 N Kent St
- 507 N Kent St
- 908 W Entiat Ave
- 929 W Entiat Ave
- 510 N Kent St
- 906 W Entiat Ave
- 930 W Entiat Ave Unit B
- 511 N Kent St
- 903 W Entiat Ave Unit NO LOCKBOX -- SEE RE
- 903 W Entiat Ave Unit INVESTORS--Land with
- 903 W Entiat Ave Unit Investment Opportuni