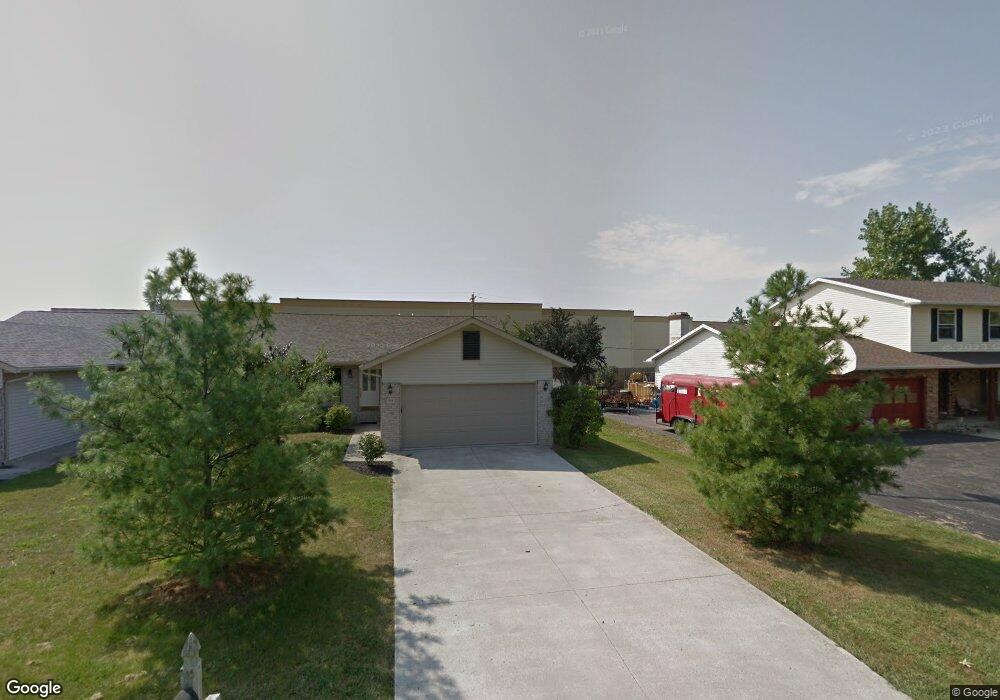
917 W Melrose Ave Findlay, OH 45840
Estimated Value: $230,000 - $237,000
2
Beds
2
Baths
1,486
Sq Ft
$157/Sq Ft
Est. Value
About This Home
This home is located at 917 W Melrose Ave, Findlay, OH 45840 and is currently estimated at $232,982, approximately $156 per square foot. 917 W Melrose Ave is a home located in Hancock County with nearby schools including Bigelow Hill Elementary School, Northview Elementary School, and Glenwood Middle School.
Ownership History
Date
Name
Owned For
Owner Type
Purchase Details
Closed on
Aug 5, 2022
Sold by
Golden James N
Bought by
James N Golden Inter-Vivos Revovable Trust
Current Estimated Value
Purchase Details
Closed on
Feb 28, 2019
Sold by
Lieb Melissa I and Lieb Gerald C
Bought by
Golden James N
Home Financials for this Owner
Home Financials are based on the most recent Mortgage that was taken out on this home.
Original Mortgage
$108,000
Interest Rate
4.4%
Mortgage Type
New Conventional
Purchase Details
Closed on
Mar 25, 2016
Bought by
Melissa I Lieb
Home Financials for this Owner
Home Financials are based on the most recent Mortgage that was taken out on this home.
Interest Rate
3.71%
Purchase Details
Closed on
Mar 1, 2012
Sold by
Koeser Dale and Koester Patricia A
Bought by
Lieb Jordan M
Home Financials for this Owner
Home Financials are based on the most recent Mortgage that was taken out on this home.
Original Mortgage
$102,600
Interest Rate
4.01%
Mortgage Type
New Conventional
Create a Home Valuation Report for This Property
The Home Valuation Report is an in-depth analysis detailing your home's value as well as a comparison with similar homes in the area
Home Values in the Area
Average Home Value in this Area
Purchase History
| Date | Buyer | Sale Price | Title Company |
|---|---|---|---|
| James N Golden Inter-Vivos Revovable Trust | -- | Schuck Robert E | |
| James N Golden Inter-Vivos Revovable Trust | -- | Schuck Robert E | |
| Golden James N | $135,000 | Mid American Title Agcy Inc | |
| Melissa I Lieb | $118,000 | -- | |
| Lieb Jordan M | $108,000 | Whitman Title Security |
Source: Public Records
Mortgage History
| Date | Status | Borrower | Loan Amount |
|---|---|---|---|
| Previous Owner | Golden James N | $108,000 | |
| Previous Owner | Melissa I Lieb | -- | |
| Previous Owner | Lieb Jordan M | $102,600 |
Source: Public Records
Tax History Compared to Growth
Tax History
| Year | Tax Paid | Tax Assessment Tax Assessment Total Assessment is a certain percentage of the fair market value that is determined by local assessors to be the total taxable value of land and additions on the property. | Land | Improvement |
|---|---|---|---|---|
| 2024 | $2,059 | $56,770 | $4,900 | $51,870 |
| 2023 | $2,062 | $56,770 | $4,900 | $51,870 |
| 2022 | $2,062 | $56,770 | $4,900 | $51,870 |
| 2021 | $1,918 | $44,950 | $3,680 | $41,270 |
| 2020 | $1,918 | $44,950 | $3,680 | $41,270 |
| 2019 | $1,874 | $44,950 | $3,680 | $41,270 |
| 2018 | $1,935 | $43,370 | $2,100 | $41,270 |
| 2017 | $1,936 | $43,370 | $2,100 | $41,270 |
| 2016 | $1,913 | $43,370 | $2,100 | $41,270 |
| 2015 | $1,599 | $36,560 | $2,100 | $34,460 |
| 2014 | $1,599 | $36,560 | $2,100 | $34,460 |
| 2012 | $1,779 | $40,390 | $2,100 | $38,290 |
Source: Public Records
Map
Nearby Homes
- 905 W Melrose Ave
- 925 W Melrose Ave
- 643 Edith Ave
- 933 Laurel Ln
- 405 Clifton Ave
- 410 Monroe Ave
- 304 Rector Ave
- 304 Prentiss Ave
- 232 Prentiss Ave
- 0 County Road 223
- 604 Davis St
- 1934 Geffs Ave
- 533 Davis St
- 1310 Muirfield Dr
- 3018 Gleneagle Dr
- 615 Hillcrest Ave
- 506 Hillcrest Ave
- 1005 Broad Ave
- 6535 Silver Lake Dr
- 1820 N Main St
- 915 W Melrose Ave Unit 915
- 909 W Melrose Ave
- 911 W Melrose Ave
- 919 W Melrose Ave
- 901 W Melrose Ave
- 914 W Melrose Ave
- 920 W Melrose Ave
- 835 W Melrose Ave
- 833 W Melrose Ave
- 933 W Melrose Ave
- 2207 Westmoor Rd
- 928 W Melrose Ave
- 823 W Melrose Ave
- 825 W Melrose Ave Unit U1
- 934 W Melrose Ave
- 2213 Westmoor Rd
- 2208 Westmoor Rd
- 2305 Springmill Rd
- 940 W Melrose Ave
- 2219 Westmoor Rd