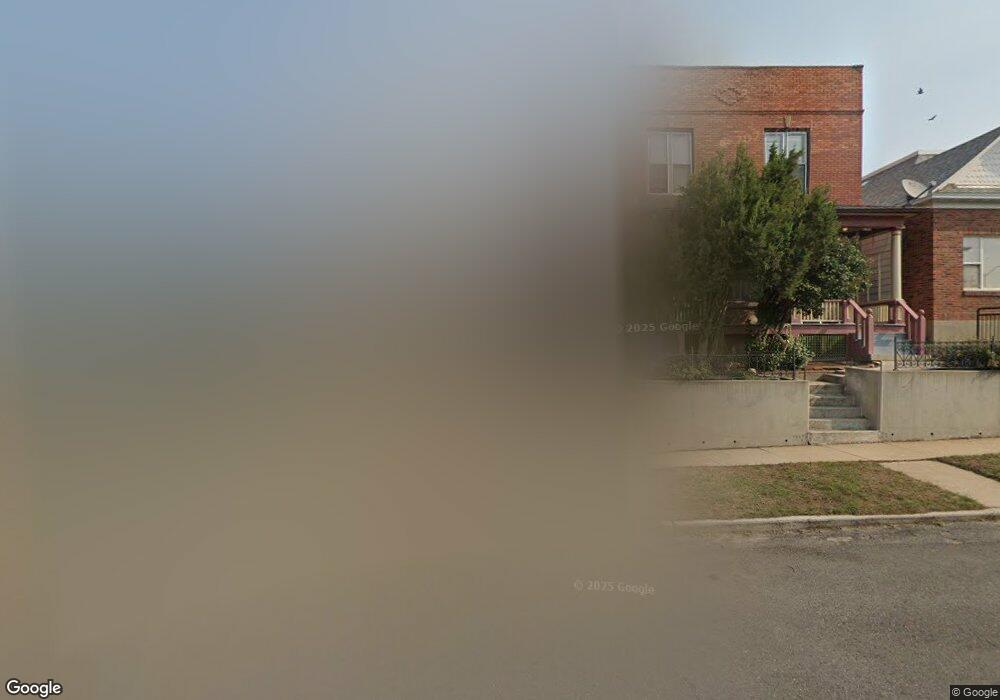
917 W Mercury St Unit 919 West Mercury Butte, MT 59701
West Side Butte NeighborhoodEstimated Value: $310,000 - $394,000
--
Bed
4
Baths
2,310
Sq Ft
$150/Sq Ft
Est. Value
About This Home
This home is located at 917 W Mercury St Unit 919 West Mercury, Butte, MT 59701 and is currently estimated at $347,477, approximately $150 per square foot. 917 W Mercury St Unit 919 West Mercury is a home located in Silver Bow County with nearby schools including West Elementary School, East Middle School, and Butte High School.
Ownership History
Date
Name
Owned For
Owner Type
Purchase Details
Closed on
Mar 26, 2024
Sold by
Spurzem William Curtis and Spurzem Patricia Katherine
Bought by
Spurzem Family Revocable Trust and Spurzem
Current Estimated Value
Home Financials for this Owner
Home Financials are based on the most recent Mortgage that was taken out on this home.
Original Mortgage
$262,500
Outstanding Balance
$258,495
Interest Rate
6.77%
Mortgage Type
New Conventional
Estimated Equity
$88,982
Purchase Details
Closed on
Mar 21, 2023
Sold by
Mclaughlin Glenn W
Bought by
Gummer Dale and Mclaughlin Emily
Home Financials for this Owner
Home Financials are based on the most recent Mortgage that was taken out on this home.
Original Mortgage
$171,000
Interest Rate
6.32%
Mortgage Type
New Conventional
Purchase Details
Closed on
Sep 9, 2011
Sold by
Citifinacial Inc
Bought by
Fties Darlene D
Create a Home Valuation Report for This Property
The Home Valuation Report is an in-depth analysis detailing your home's value as well as a comparison with similar homes in the area
Home Values in the Area
Average Home Value in this Area
Purchase History
| Date | Buyer | Sale Price | Title Company |
|---|---|---|---|
| Spurzem Family Revocable Trust | -- | None Listed On Document | |
| Spurzem William Curtis | -- | None Listed On Document | |
| Gummer Dale | -- | -- | |
| Fties Darlene D | -- | -- |
Source: Public Records
Mortgage History
| Date | Status | Borrower | Loan Amount |
|---|---|---|---|
| Open | Spurzem William Curtis | $262,500 | |
| Previous Owner | Gummer Dale | $171,000 |
Source: Public Records
Tax History Compared to Growth
Tax History
| Year | Tax Paid | Tax Assessment Tax Assessment Total Assessment is a certain percentage of the fair market value that is determined by local assessors to be the total taxable value of land and additions on the property. | Land | Improvement |
|---|---|---|---|---|
| 2025 | $3,142 | $352,000 | $0 | $0 |
| 2024 | $3,694 | $303,800 | $0 | $0 |
| 2023 | $3,151 | $232,800 | $0 | $0 |
| 2022 | $2,584 | $144,100 | $0 | $0 |
| 2021 | $1,596 | $144,100 | $0 | $0 |
| 2020 | $2,236 | $104,300 | $0 | $0 |
| 2019 | $2,216 | $104,300 | $0 | $0 |
| 2018 | $2,041 | $92,300 | $0 | $0 |
| 2017 | $937 | $92,300 | $0 | $0 |
| 2016 | $1,867 | $88,100 | $0 | $0 |
| 2015 | $930 | $88,100 | $0 | $0 |
| 2014 | $1,618 | $39,908 | $0 | $0 |
Source: Public Records
Map
Nearby Homes
- 1043 W Galena St
- 1041 W Galena St
- 1045 W Galena St
- 11 N Henry Ave
- 705 W Park St
- 1039 W Broadway St
- 109 S Crystal St
- 207 S Crystal St
- TBD W Galena St
- 1106 W Porphyry St
- 1003 W Granite St
- 216 N Emmett Ave
- 223 S Jackson St
- 905 W Copper St
- 600 W Gold St
- TBD W Copper St
- Lots 5-6 W Copper St
- 1201 W Platinum St
- 631 S Clark St
- 1147 Steel St
- 917 W Mercury St
- 913 W Mercury St
- 923 W Mercury St
- 927 W Mercury St
- 911 W Mercury St
- 915 W Mercury St
- 115 S Excelsior Ave
- 127 S Excelsior Ave
- 912 W Galena St
- 109 S Excelsior Ave
- 1001 W Mercury St
- 118 S Excelsior Ave
- 118 S Excelsior Ave Unit Lower
- 118 S Excelsior Ave Unit 118 Excelsior
- 1000 W Galena St
- 210 -214 S Excelsior
- 116 S Excelsior Ave
- 116 S Excelsior Ave Unit 116 Upper
- 120 S Excelsior Ave
- 130 S Excelsior Ave