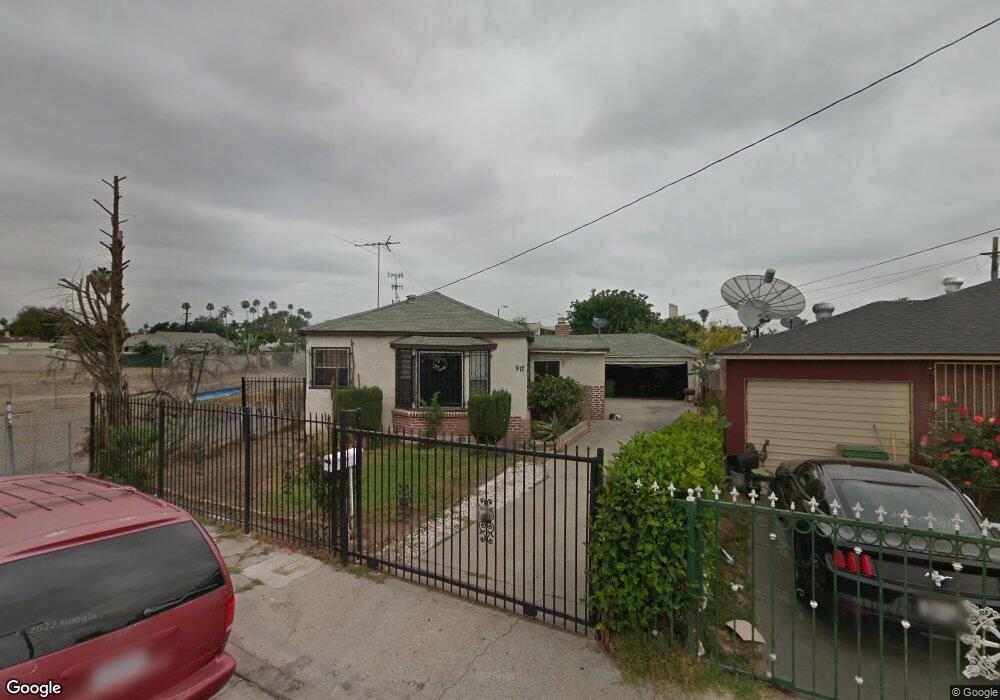
917 W Spruce St Compton, CA 90220
Estimated Value: $611,000 - $629,054
4
Beds
2
Baths
1,333
Sq Ft
$466/Sq Ft
Est. Value
About This Home
This home is located at 917 W Spruce St, Compton, CA 90220 and is currently estimated at $620,764, approximately $465 per square foot. 917 W Spruce St is a home located in Los Angeles County with nearby schools including Washington Elementary School, Benjamin O. Davis Middle School, and Compton High School.
Ownership History
Date
Name
Owned For
Owner Type
Purchase Details
Closed on
Nov 10, 2022
Sold by
Navarro Jesus Rayas and Navarro Maria Del
Bought by
2022 Jesus & Maria Rays Cano Family Trust
Current Estimated Value
Purchase Details
Closed on
Oct 12, 2006
Sold by
Rayas Jesus
Bought by
Rayas Maria Del Carmen
Home Financials for this Owner
Home Financials are based on the most recent Mortgage that was taken out on this home.
Original Mortgage
$225,000
Interest Rate
6.46%
Mortgage Type
New Conventional
Purchase Details
Closed on
Apr 3, 1996
Sold by
Richardson Ruth C
Bought by
Rayas Jesus and Rayas Maria Delcarmen
Home Financials for this Owner
Home Financials are based on the most recent Mortgage that was taken out on this home.
Original Mortgage
$132,413
Interest Rate
7.82%
Mortgage Type
FHA
Create a Home Valuation Report for This Property
The Home Valuation Report is an in-depth analysis detailing your home's value as well as a comparison with similar homes in the area
Home Values in the Area
Average Home Value in this Area
Purchase History
| Date | Buyer | Sale Price | Title Company |
|---|---|---|---|
| 2022 Jesus & Maria Rays Cano Family Trust | -- | -- | |
| Navarro Jesus Rayas | -- | -- | |
| Rayas Maria Del Carmen | -- | Investors Title Company | |
| Rayas Jesus | $134,000 | Southland Title Corporation |
Source: Public Records
Mortgage History
| Date | Status | Borrower | Loan Amount |
|---|---|---|---|
| Previous Owner | Rayas Maria Del Carmen | $225,000 | |
| Previous Owner | Rayas Jesus | $132,413 |
Source: Public Records
Tax History
| Year | Tax Paid | Tax Assessment Tax Assessment Total Assessment is a certain percentage of the fair market value that is determined by local assessors to be the total taxable value of land and additions on the property. | Land | Improvement |
|---|---|---|---|---|
| 2025 | $4,408 | $222,582 | $94,509 | $128,073 |
| 2024 | $4,408 | $218,218 | $92,656 | $125,562 |
| 2023 | $4,345 | $213,940 | $90,840 | $123,100 |
| 2022 | $3,792 | $209,746 | $89,059 | $120,687 |
| 2021 | $3,824 | $205,634 | $87,313 | $118,321 |
| 2019 | $3,716 | $199,536 | $84,724 | $114,812 |
| 2018 | $3,575 | $195,624 | $83,063 | $112,561 |
| 2016 | $3,397 | $188,030 | $79,839 | $108,191 |
| 2015 | $3,247 | $185,206 | $78,640 | $106,566 |
| 2014 | $3,192 | $181,579 | $77,100 | $104,479 |
Source: Public Records
Map
Nearby Homes
- 836 W Cedar St
- 806 W Spruce St
- 814 W Maple St
- 720 W Cherry St
- 910 W 138th St
- 940 W Brazil St
- 629 W Plum St
- 701 W 139th St
- 910 W Palmer St
- 720 W 137th St
- 316 N Maie Ave
- 1608 N Grape Ave
- 213 N Broadacres Ave
- 1716 N Grandee Ave
- 800 N Kalsman Ave
- 522 W Cherry St
- 640 W Palmer St
- 521 W Cherry St
- 9607 S Evers Ave
- 813 W Stockwell St
- 931 W Spruce St
- 913 W Spruce St
- 909 W Spruce St
- 905 W Spruce St
- 912 W Spruce St
- 901 W Spruce St
- 908 W Spruce St
- 928 W Spruce St
- 906 W Spruce St
- 930 W Spruce St
- 937 W Spruce St
- 936 W Rosecrans Ave
- 932 W Spruce St
- 902 W Spruce St
- 919 Rosecrans Ave
- 917 W Rosecrans Ave
- 915 Rosecrans Ave
- 900 W Spruce St
- 0 W Spruce St Unit SR21187643
- 925 W Maple St
Your Personal Tour Guide
Ask me questions while you tour the home.