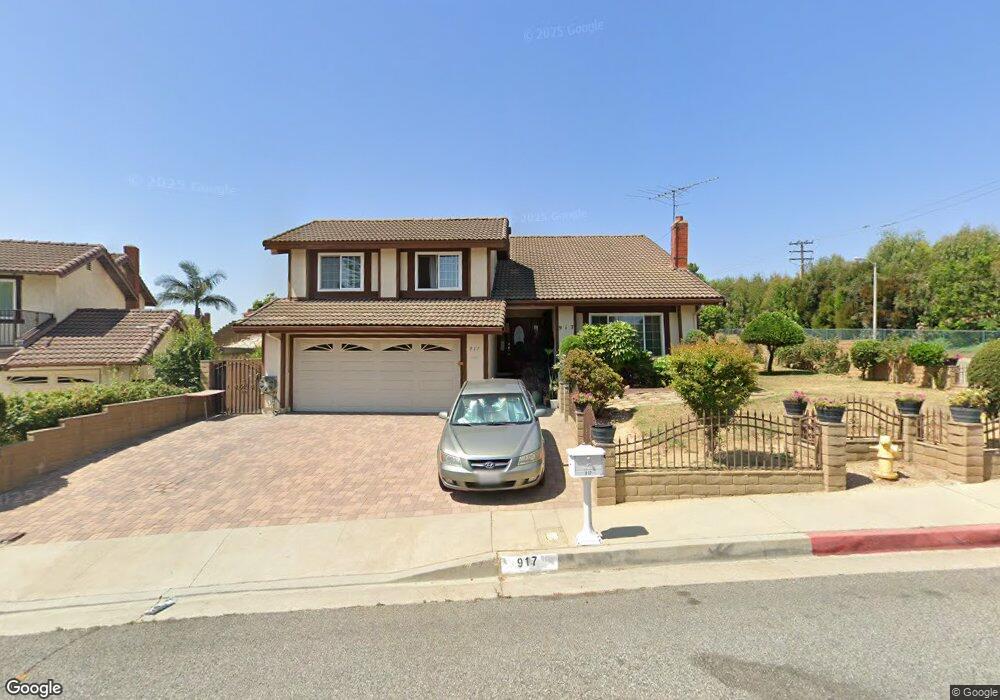
917 W Suffolk Ave Montebello, CA 90640
Estimated Value: $1,047,000 - $1,129,565
4
Beds
3
Baths
2,783
Sq Ft
$390/Sq Ft
Est. Value
About This Home
This home is located at 917 W Suffolk Ave, Montebello, CA 90640 and is currently estimated at $1,086,141, approximately $390 per square foot. 917 W Suffolk Ave is a home located in Los Angeles County with nearby schools including La Merced Elementary School, La Merced Intermediate School, and Montebello High School.
Ownership History
Date
Name
Owned For
Owner Type
Purchase Details
Closed on
May 4, 2012
Sold by
Dela Pena Daniel
Bought by
Dela Pena Evie
Current Estimated Value
Home Financials for this Owner
Home Financials are based on the most recent Mortgage that was taken out on this home.
Original Mortgage
$359,000
Outstanding Balance
$247,446
Interest Rate
3.79%
Mortgage Type
New Conventional
Estimated Equity
$838,695
Purchase Details
Closed on
Jul 18, 2007
Sold by
Abalo Emelina O
Bought by
Abalo Emelina O and The Emelina O Abalo Living Tru
Purchase Details
Closed on
Sep 26, 2000
Sold by
Abalo Rufo C and Abalo Emelina O
Bought by
Abalo Rufo C and Abalo Emelina O
Home Financials for this Owner
Home Financials are based on the most recent Mortgage that was taken out on this home.
Original Mortgage
$43,000
Interest Rate
8.01%
Mortgage Type
Stand Alone Second
Purchase Details
Closed on
May 19, 1998
Sold by
Abalo Rufo C and Abalo Emelina O
Bought by
Abalo Rufo C and Abalo Emelina O
Home Financials for this Owner
Home Financials are based on the most recent Mortgage that was taken out on this home.
Original Mortgage
$277,435
Interest Rate
7.17%
Create a Home Valuation Report for This Property
The Home Valuation Report is an in-depth analysis detailing your home's value as well as a comparison with similar homes in the area
Home Values in the Area
Average Home Value in this Area
Purchase History
| Date | Buyer | Sale Price | Title Company |
|---|---|---|---|
| Dela Pena Evie | -- | None Available | |
| Abalo Emelina O | -- | None Available | |
| Abalo Rufo C | -- | Fidelity National Title | |
| Abalo Rufo C | -- | Orange Coast Title |
Source: Public Records
Mortgage History
| Date | Status | Borrower | Loan Amount |
|---|---|---|---|
| Open | Dela Pena Evie | $359,000 | |
| Closed | Abalo Rufo C | $43,000 | |
| Previous Owner | Abalo Rufo C | $277,435 |
Source: Public Records
Tax History Compared to Growth
Tax History
| Year | Tax Paid | Tax Assessment Tax Assessment Total Assessment is a certain percentage of the fair market value that is determined by local assessors to be the total taxable value of land and additions on the property. | Land | Improvement |
|---|---|---|---|---|
| 2025 | $7,143 | $182,442 | $38,139 | $144,303 |
| 2024 | $7,143 | $178,866 | $37,392 | $141,474 |
| 2023 | $7,122 | $175,359 | $36,659 | $138,700 |
| 2022 | $7,016 | $171,922 | $35,941 | $135,981 |
| 2021 | $6,888 | $168,552 | $35,237 | $133,315 |
| 2020 | $6,818 | $166,825 | $34,876 | $131,949 |
| 2019 | $6,744 | $163,555 | $34,193 | $129,362 |
| 2018 | $6,705 | $160,349 | $33,523 | $126,826 |
| 2016 | $6,530 | $151,843 | $32,222 | $119,621 |
| 2015 | $2,522 | $149,563 | $31,738 | $117,825 |
| 2014 | $2,497 | $146,634 | $31,117 | $115,517 |
Source: Public Records
Map
Nearby Homes
- 1018 W Yorktown Ave
- 929 W Ashiya Rd
- 228 Mullberry Place
- 378 Mullberry Place
- 211 Peacock Ln
- 48 Primrose Ct
- 861 Marconi St
- 1155 Poppy Ct
- 1413 Cuesta Way
- 1108 Poppy Ct
- 1198 Poppy Ct
- 1500 Aldea Dr
- 909 Brighton Way
- 1012 Burke Dr
- 1602 Via Palermo
- 105 Remy Ln
- 25 Remy Ln
- 15 Remy Ln
- 55 Remy Ln
- Apex Plan at Metro Heights - Viewpoint
- 913 W Suffolk Ave
- 1020 N Iguala St
- 909 W Suffolk Ave
- 1016 N Iguala St
- 1104 N Iguala St
- 924 W Bunker Hill Ave
- 905 W Suffolk Ave
- 920 W Bunker Hill Ave
- 908 W Suffolk Ave
- 1108 N Iguala St
- 916 W Bunker Hill Ave
- 901 W Suffolk Ave
- 1112 N Iguala St
- 904 W Suffolk Ave
- 1015 N Iguala St
- 912 W Bunker Hill Ave
- 1012 N Iguala St
- 837 W Suffolk Ave
- 1011 N Iguala St
- 900 W Suffolk Ave