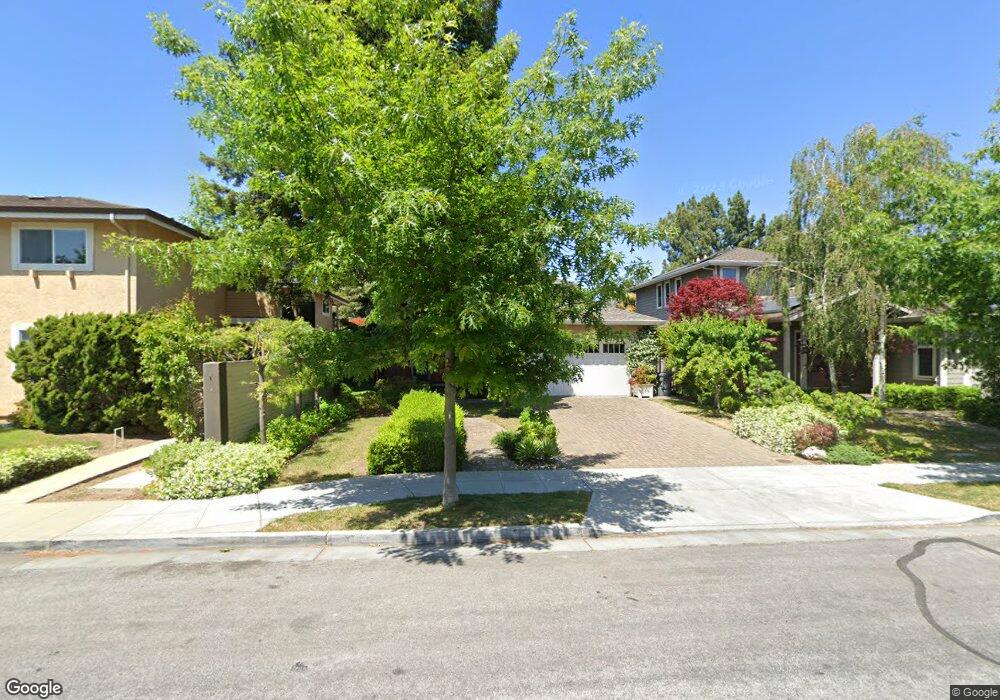
918 Azure St Sunnyvale, CA 94087
Estimated Value: $2,687,000 - $3,611,000
4
Beds
4
Baths
2,565
Sq Ft
$1,283/Sq Ft
Est. Value
About This Home
This home is located at 918 Azure St, Sunnyvale, CA 94087 and is currently estimated at $3,291,959, approximately $1,283 per square foot. 918 Azure St is a home located in Santa Clara County with nearby schools including Ellis Elementary School, Sunnyvale Middle School, and Fremont High School.
Ownership History
Date
Name
Owned For
Owner Type
Purchase Details
Closed on
Feb 6, 2010
Sold by
Fukui Billy S and Fukui Yuriye
Bought by
Demtchouk Alexander and Demtchouk Irina
Current Estimated Value
Home Financials for this Owner
Home Financials are based on the most recent Mortgage that was taken out on this home.
Original Mortgage
$650,000
Outstanding Balance
$429,975
Interest Rate
5.02%
Mortgage Type
New Conventional
Estimated Equity
$2,861,984
Purchase Details
Closed on
Jun 14, 2006
Sold by
Bautista Jeffrey G and Bautista Janis H
Bought by
Fukui Billy S and Fukui Yuriye
Home Financials for this Owner
Home Financials are based on the most recent Mortgage that was taken out on this home.
Original Mortgage
$752,500
Interest Rate
6.76%
Mortgage Type
Purchase Money Mortgage
Purchase Details
Closed on
Feb 14, 2005
Sold by
Bautista Justin S
Bought by
Bautista Justin S
Create a Home Valuation Report for This Property
The Home Valuation Report is an in-depth analysis detailing your home's value as well as a comparison with similar homes in the area
Home Values in the Area
Average Home Value in this Area
Purchase History
| Date | Buyer | Sale Price | Title Company |
|---|---|---|---|
| Demtchouk Alexander | -- | Fidelity National Title Co | |
| Fukui Billy S | $1,625,000 | Alliance Title Company | |
| Bautista Justin S | -- | -- | |
| Bautista Justin S | -- | -- |
Source: Public Records
Mortgage History
| Date | Status | Borrower | Loan Amount |
|---|---|---|---|
| Open | Demtchouk Alexander | $650,000 | |
| Previous Owner | Fukui Billy S | $752,500 |
Source: Public Records
Tax History Compared to Growth
Tax History
| Year | Tax Paid | Tax Assessment Tax Assessment Total Assessment is a certain percentage of the fair market value that is determined by local assessors to be the total taxable value of land and additions on the property. | Land | Improvement |
|---|---|---|---|---|
| 2025 | $17,664 | $1,548,979 | $903,572 | $645,407 |
| 2024 | $17,664 | $1,518,607 | $885,855 | $632,752 |
| 2023 | $17,457 | $1,488,832 | $868,486 | $620,346 |
| 2022 | $17,121 | $1,459,640 | $851,457 | $608,183 |
| 2021 | $16,946 | $1,431,020 | $834,762 | $596,258 |
| 2020 | $16,730 | $1,416,348 | $826,203 | $590,145 |
| 2019 | $16,353 | $1,388,577 | $810,003 | $578,574 |
| 2018 | $16,026 | $1,361,351 | $794,121 | $567,230 |
| 2017 | $15,819 | $1,334,658 | $778,550 | $556,108 |
| 2016 | $15,168 | $1,308,489 | $763,285 | $545,204 |
| 2015 | $15,260 | $1,288,835 | $751,820 | $537,015 |
| 2014 | $14,955 | $1,263,589 | $737,093 | $526,496 |
Source: Public Records
Map
Nearby Homes
- 152 Brahms Way
- 654 Princeton Dr
- 1140 Snowberry Ct
- 541 Holthouse Terrace
- 745 Reseda Dr
- 1229 Picasso Dr
- Plan 7 at Vida
- Plan 4 at Vida
- Plan 2 at Vida
- Plan 8 at Vida
- Plan 1 at Vida
- Plan 3 at Vida
- Plan 5 at Vida
- Plan 6 at Vida
- 481 S Murphy Ave
- 1303 Besra Terrace Unit 2
- 1303 Besra Terrace Unit 5
- 1303 Besra Terrace Unit 13
- 1303 Besra Terrace Unit 7
- 1304 Barbet Cir Unit 6
- 910 Azure St
- 932 Sunnyvale Saratoga Rd
- 902 Azure St
- 113 Debussy Terrace
- 935 Azure St
- 114 Debussy Terrace
- 901 Azure St
- 0 Cumulus Ave
- 103 Cumulus Ave
- 126 Debussy Terrace
- 125 Debussy Terrace
- 114 Cumulus Ave
- 901 Sunnyvale Saratoga Rd
- 906 Zinfandel Way
- 884 Azure St
- 138 Debussy Terrace
- 902 Zinfandel Way
- 897 Azure St
- 940 Azure St
- 137 Debussy Terrace