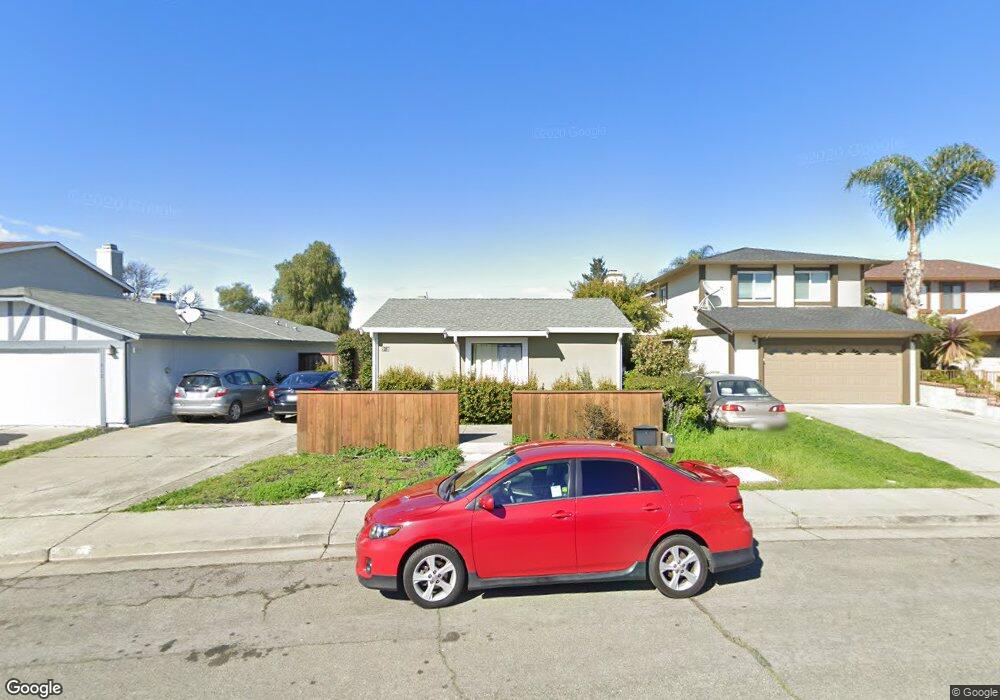
918 Brandon Way Fairfield, CA 94533
Estimated Value: $432,000 - $477,000
3
Beds
2
Baths
1,196
Sq Ft
$384/Sq Ft
Est. Value
About This Home
This home is located at 918 Brandon Way, Fairfield, CA 94533 and is currently estimated at $458,797, approximately $383 per square foot. 918 Brandon Way is a home located in Solano County with nearby schools including Cleo Gordon Elementary School, Grange Middle School, and Fairfield High School.
Ownership History
Date
Name
Owned For
Owner Type
Purchase Details
Closed on
Jun 7, 2021
Sold by
Sam Mary Patricia
Bought by
Williams Tavenia and Mary P Sam Living Trust
Current Estimated Value
Purchase Details
Closed on
Jan 30, 2004
Sold by
Reese Martin J F and Reese Sonia Y
Bought by
Sam Mary Patricia
Home Financials for this Owner
Home Financials are based on the most recent Mortgage that was taken out on this home.
Original Mortgage
$218,400
Outstanding Balance
$100,448
Interest Rate
6%
Mortgage Type
Purchase Money Mortgage
Estimated Equity
$358,349
Purchase Details
Closed on
Sep 20, 1994
Sold by
Reese Martin James Fitzgerald
Bought by
Reese Martin J F and Reese Sonia Y
Home Financials for this Owner
Home Financials are based on the most recent Mortgage that was taken out on this home.
Original Mortgage
$108,901
Interest Rate
8.58%
Mortgage Type
FHA
Purchase Details
Closed on
Jun 2, 1994
Sold by
Reese Wesley J and Reese Valena L
Bought by
Reese Martin James Fitzgerald
Create a Home Valuation Report for This Property
The Home Valuation Report is an in-depth analysis detailing your home's value as well as a comparison with similar homes in the area
Home Values in the Area
Average Home Value in this Area
Purchase History
| Date | Buyer | Sale Price | Title Company |
|---|---|---|---|
| Williams Tavenia | -- | None Available | |
| Sam Mary Patricia | $273,000 | Fidelity Title Co | |
| Reese Martin J F | -- | North American Title Company | |
| Reese Martin James Fitzgerald | -- | -- |
Source: Public Records
Mortgage History
| Date | Status | Borrower | Loan Amount |
|---|---|---|---|
| Open | Sam Mary Patricia | $218,400 | |
| Previous Owner | Reese Martin J F | $108,901 | |
| Closed | Sam Mary Patricia | $54,600 |
Source: Public Records
Tax History
| Year | Tax Paid | Tax Assessment Tax Assessment Total Assessment is a certain percentage of the fair market value that is determined by local assessors to be the total taxable value of land and additions on the property. | Land | Improvement |
|---|---|---|---|---|
| 2025 | $4,342 | $388,139 | $85,303 | $302,836 |
| 2024 | $4,342 | $380,530 | $83,631 | $296,899 |
| 2023 | $4,130 | $373,070 | $81,992 | $291,078 |
| 2022 | $4,078 | $365,756 | $80,385 | $285,371 |
| 2021 | $4,037 | $358,585 | $78,809 | $279,776 |
| 2020 | $3,941 | $347,951 | $76,472 | $271,479 |
| 2019 | $3,843 | $341,129 | $74,973 | $266,156 |
| 2018 | $3,622 | $312,000 | $53,000 | $259,000 |
| 2017 | $3,466 | $307,000 | $55,000 | $252,000 |
| 2016 | $2,845 | $250,000 | $45,000 | $205,000 |
| 2015 | $2,674 | $248,000 | $47,000 | $201,000 |
| 2014 | $2,280 | $210,000 | $40,000 | $170,000 |
Source: Public Records
Map
Nearby Homes
- 1129 Scott St
- 1695 Blossom Ave
- 1048 E Tabor Ave
- 1941 Grande Cir Unit 45
- 1941 Grande Cir Unit 48
- 1130 Silk Oak Dr
- 1970 Grande Cir Unit 9
- 1113 Strawberry Ln
- 1012 Sparrow Ln
- 1045 Camellia Ct
- 117 Summertime Ln
- 1312 Phillip Way
- 1812 San Jose Place
- 507 Kings Way Unit B
- 66 Villa Cir
- 237 Del Loma Ct
- 1669 Rutledge Ln
- 1541 Rayburn Ct
- 942 Edgewood Cir
- 120 Railroad Ave
- 924 Brandon Way
- 906 Brandon Way
- 930 Brandon Way
- 936 Brandon Way
- 900 Brandon Way
- 942 Brandon Way
- 925 Brandon Way
- 931 Brandon Way
- 913 Brandon Way
- 1776 Sunset Ave
- 937 Brandon Way
- 948 Brandon Way
- 907 Brandon Way
- 943 Brandon Way
- 901 Brandon Way
- 892 Sunset Ct
- 956 Brandon Way
- 949 Brandon Way
- 1771 Sunset Ave