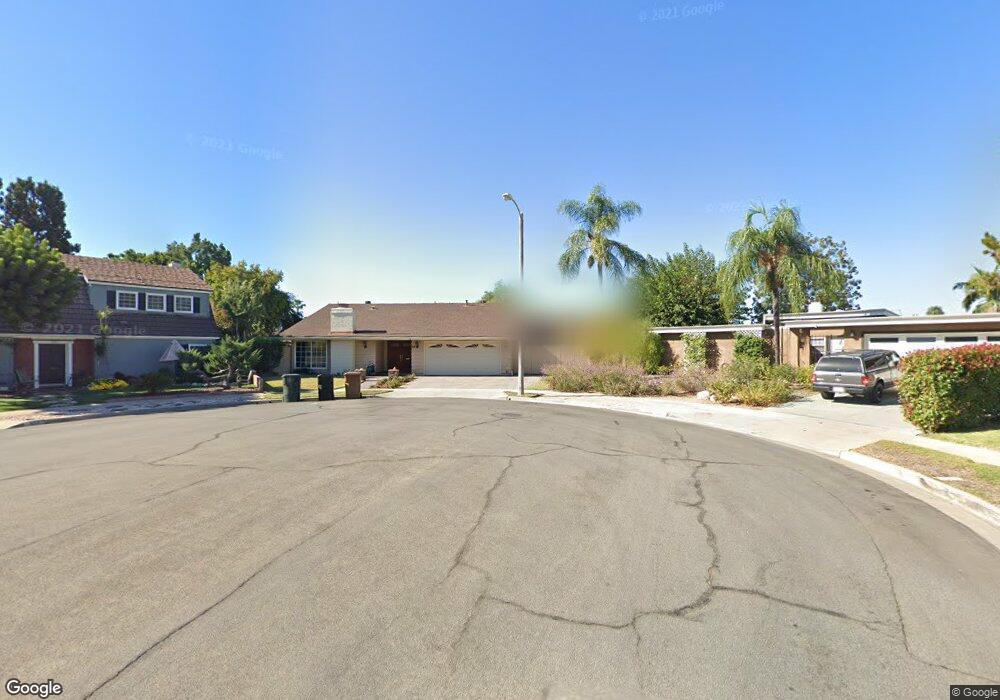
918 Brent Cir Placentia, CA 92870
Estimated Value: $1,222,000 - $1,306,000
4
Beds
2
Baths
2,183
Sq Ft
$577/Sq Ft
Est. Value
About This Home
This home is located at 918 Brent Cir, Placentia, CA 92870 and is currently estimated at $1,258,777, approximately $576 per square foot. 918 Brent Cir is a home located in Orange County with nearby schools including Wagner Elementary School, Col. J. K. Tuffree Middle School, and El Dorado High School.
Ownership History
Date
Name
Owned For
Owner Type
Purchase Details
Closed on
Dec 23, 2014
Sold by
Gee Daniel Gene
Bought by
Gee Daniel Gene and Nguyen Phuong Thi Diem
Current Estimated Value
Home Financials for this Owner
Home Financials are based on the most recent Mortgage that was taken out on this home.
Original Mortgage
$427,500
Outstanding Balance
$327,462
Interest Rate
3.92%
Mortgage Type
New Conventional
Estimated Equity
$931,315
Purchase Details
Closed on
Jul 20, 2010
Sold by
Sadlier Mary Ann
Bought by
Gee Daniel Gene
Home Financials for this Owner
Home Financials are based on the most recent Mortgage that was taken out on this home.
Original Mortgage
$454,800
Interest Rate
4.71%
Mortgage Type
New Conventional
Purchase Details
Closed on
Mar 27, 2007
Sold by
Tooley Richard D and Tooley Marita
Bought by
Sadlier Mary Ann
Home Financials for this Owner
Home Financials are based on the most recent Mortgage that was taken out on this home.
Original Mortgage
$471,500
Interest Rate
6.11%
Mortgage Type
Purchase Money Mortgage
Create a Home Valuation Report for This Property
The Home Valuation Report is an in-depth analysis detailing your home's value as well as a comparison with similar homes in the area
Home Values in the Area
Average Home Value in this Area
Purchase History
| Date | Buyer | Sale Price | Title Company |
|---|---|---|---|
| Gee Daniel Gene | -- | None Available | |
| Gee Daniel Gene | $568,500 | Fidelity National Title | |
| Sadlier Mary Ann | $671,500 | Southland Title Company |
Source: Public Records
Mortgage History
| Date | Status | Borrower | Loan Amount |
|---|---|---|---|
| Open | Gee Daniel Gene | $427,500 | |
| Closed | Gee Daniel Gene | $454,800 | |
| Previous Owner | Sadlier Mary Ann | $471,500 |
Source: Public Records
Tax History Compared to Growth
Tax History
| Year | Tax Paid | Tax Assessment Tax Assessment Total Assessment is a certain percentage of the fair market value that is determined by local assessors to be the total taxable value of land and additions on the property. | Land | Improvement |
|---|---|---|---|---|
| 2025 | $8,444 | $728,344 | $591,098 | $137,246 |
| 2024 | $8,444 | $714,063 | $579,508 | $134,555 |
| 2023 | $8,274 | $700,062 | $568,145 | $131,917 |
| 2022 | $8,166 | $686,336 | $557,005 | $129,331 |
| 2021 | $7,981 | $672,879 | $546,083 | $126,796 |
| 2020 | $8,006 | $665,980 | $540,484 | $125,496 |
| 2019 | $7,691 | $652,922 | $529,886 | $123,036 |
| 2018 | $7,593 | $640,120 | $519,496 | $120,624 |
| 2017 | $7,466 | $627,569 | $509,310 | $118,259 |
| 2016 | $7,316 | $615,264 | $499,323 | $115,941 |
| 2015 | $7,224 | $606,023 | $491,823 | $114,200 |
| 2014 | $7,017 | $594,152 | $482,189 | $111,963 |
Source: Public Records
Map
Nearby Homes
- 4942 Gem Ln
- 4882 Kermath St
- 1261 Desoto St
- 619 E Yorba Linda Blvd
- 1429 Prospect Ave Unit B
- 16692 Meadowview Dr
- 615 Jensen Place
- 17001 La Kenice Way
- 727 Olivier Dr
- 732 Olivier Dr
- 439 Normandy Ave
- 726 Olivier Dr
- 4802 Brookway Ave
- 1701 Shaw Cir
- 707 Olivier Dr
- 718 Olivier Dr
- 421 Larry Ln
- 4781 Kona Kove Way
- 714 Olivier Dr
- 653 Patten Ave