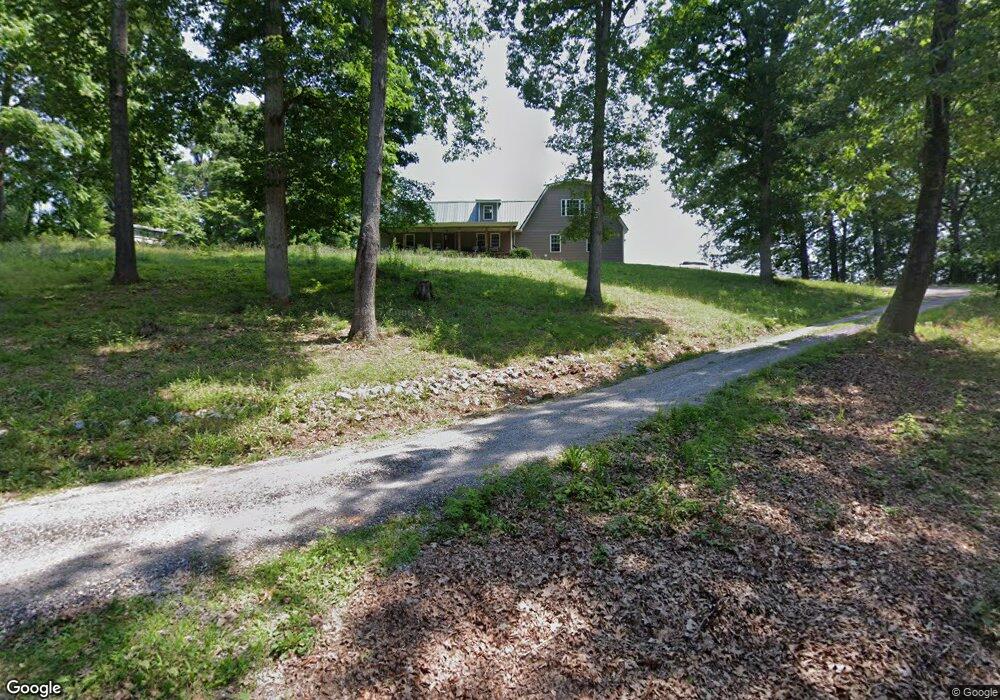
918 Calloway Rd Rutledge, TN 37861
Estimated Value: $340,000 - $447,000
Studio
2
Baths
1,792
Sq Ft
$218/Sq Ft
Est. Value
About This Home
This home is located at 918 Calloway Rd, Rutledge, TN 37861 and is currently estimated at $391,340, approximately $218 per square foot. 918 Calloway Rd is a home located in Grainger County with nearby schools including Joppa Elementary School, Rutledge Middle School, and Grainger High School.
Ownership History
Date
Name
Owned For
Owner Type
Purchase Details
Closed on
Jun 13, 2024
Sold by
Sly Eric D and Sly Tammy
Bought by
Sly Eric D and Sly Tammy
Current Estimated Value
Purchase Details
Closed on
Oct 6, 2022
Sold by
Connelly Ariel Lynn Sly and Connelly Eric Douglas
Bought by
Connelly Ariel Lynn Sly and Connelly Kevin Michael
Purchase Details
Closed on
Aug 19, 2022
Sold by
Sly Connelly Ariel Lynn
Bought by
Sly Eric Douglas and Sly Tammy Lynn
Purchase Details
Closed on
Sep 21, 2020
Sold by
Couch April
Bought by
Connelly Ariel Lynn Sly and Sly Eric Douglas
Home Financials for this Owner
Home Financials are based on the most recent Mortgage that was taken out on this home.
Original Mortgage
$204,250
Interest Rate
2.9%
Mortgage Type
New Conventional
Purchase Details
Closed on
Jul 31, 2020
Sold by
Couch Travis
Bought by
Couch April
Home Financials for this Owner
Home Financials are based on the most recent Mortgage that was taken out on this home.
Original Mortgage
$204,250
Interest Rate
2.9%
Mortgage Type
New Conventional
Purchase Details
Closed on
Apr 9, 1992
Bought by
Owens Kenneth and Owens Pamela
Create a Home Valuation Report for This Property
The Home Valuation Report is an in-depth analysis detailing your home's value as well as a comparison with similar homes in the area
Purchase History
| Date | Buyer | Sale Price | Title Company |
|---|---|---|---|
| Sly Eric D | -- | None Listed On Document | |
| Sly Eric D | -- | None Listed On Document | |
| Connelly Ariel Lynn Sly | -- | -- | |
| Connelly Ariel Lynn Sly | -- | None Listed On Document | |
| Sly Eric Douglas | -- | Hinsley Kelley | |
| Sly Eric Douglas | -- | Hinsley Kelley | |
| Connelly Ariel Lynn Sly | $215,000 | None Available | |
| Couch April | -- | None Available | |
| Owens Kenneth | $1,000 | -- |
Source: Public Records
Mortgage History
| Date | Status | Borrower | Loan Amount |
|---|---|---|---|
| Previous Owner | Connelly Ariel Lynn Sly | $204,250 |
Source: Public Records
Tax History
| Year | Tax Paid | Tax Assessment Tax Assessment Total Assessment is a certain percentage of the fair market value that is determined by local assessors to be the total taxable value of land and additions on the property. | Land | Improvement |
|---|---|---|---|---|
| 2025 | $1,137 | $48,400 | $13,175 | $35,225 |
| 2024 | $1,137 | $48,400 | $13,175 | $35,225 |
| 2023 | $1,137 | $48,400 | $13,175 | $35,225 |
| 2022 | $1,112 | $48,400 | $13,175 | $35,225 |
| 2021 | $1,112 | $48,400 | $13,175 | $35,225 |
| 2020 | $1,058 | $48,400 | $13,175 | $35,225 |
| 2019 | $1,058 | $37,800 | $13,350 | $24,450 |
| 2018 | $915 | $37,800 | $13,350 | $24,450 |
| 2017 | $915 | $37,800 | $13,350 | $24,450 |
| 2016 | $724 | $37,800 | $13,350 | $24,450 |
| 2015 | $696 | $29,900 | $5,450 | $24,450 |
| 2014 | $696 | $27,831 | $0 | $0 |
Source: Public Records
Map
Nearby Homes
- 0 Holston Shores Dr Unit RTC3152326
- 2324 Holston View Rd
- 00 Mary Ln
- 124 Holston Acres Dr
- Lot 8 Holston Shores Dr
- 824 Howell River Rd
- 734 Howell River Rd
- 000 Holston Shores Dr
- 925 Holston Shores Dr
- 1174 Howell River Rd
- 915 Howell River Rd
- 1227 Holston Shores Dr
- 8 Schertz Ln
- 1450 Howell River Rd
- 1478 Howell River Rd
- 1486 Howell River Rd
- 897 Lookout Dr
- 1982 Holston Shores Dr
- 0 Collins Rd
- 2005 River Mist Cir
- 0 Calloway Rd
- 5434 Indian Ridge Rd
- 5502 Indian Ridge Rd
- 1022 Calloway Rd
- 0 Calloway Rd Unit 916783
- 35.05 Indian Ridge Rd
- 5527 Indian Ridge Rd
- 765 Calloway Rd
- 118 Cave Rd
- 5219 Indian Ridge Rd
- 5658 Indian Ridge Rd
- 210 Hillside Ln
- 180 Hillside Ln
- 5148 Indian Ridge Rd
- 685 Calloway Rd
- 203 Hillside Ln
- LOT 56 Hillside Estates
- 5040 Indian Ridge Rd
- 100 Yates Dr
- 99 Yates Dr
Your Personal Tour Guide
Ask me questions while you tour the home.