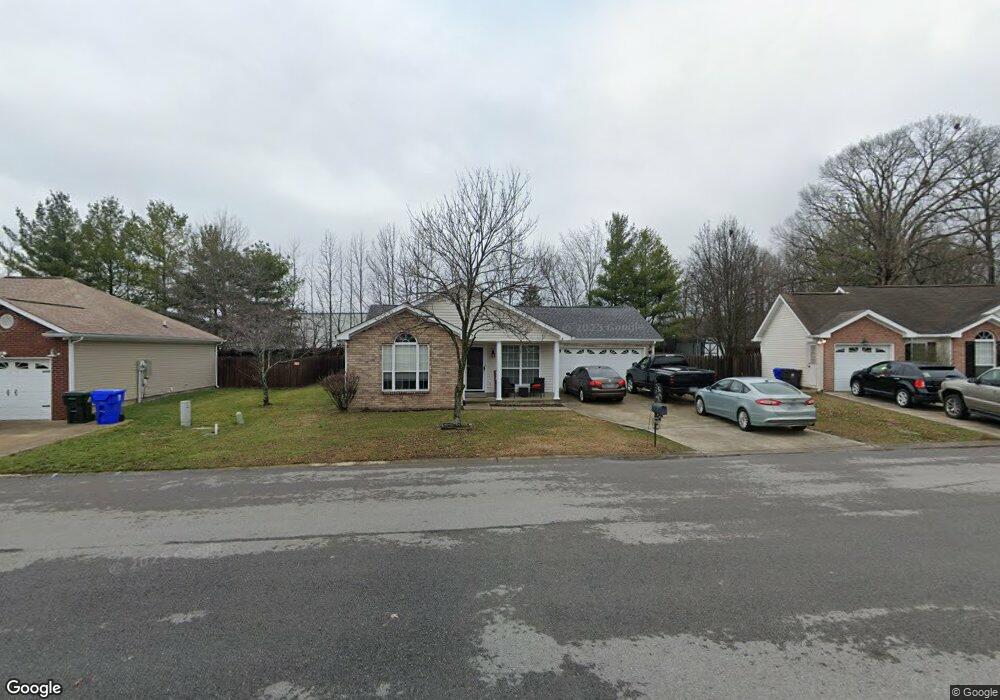
918 Chesire Ct White House, TN 37188
Estimated Value: $313,411 - $334,000
--
Bed
2
Baths
1,274
Sq Ft
$256/Sq Ft
Est. Value
About This Home
This home is located at 918 Chesire Ct, White House, TN 37188 and is currently estimated at $326,103, approximately $255 per square foot. 918 Chesire Ct is a home located in Robertson County with nearby schools including Robert F. Woodall Elementary School, White House Heritage Elementary School, and White House Heritage High School.
Ownership History
Date
Name
Owned For
Owner Type
Purchase Details
Closed on
Jan 23, 2017
Sold by
Spivey Kyle E and Spivey Jenny L
Bought by
Ledford Jeremy C and Ledford Courtney A
Current Estimated Value
Purchase Details
Closed on
May 16, 2013
Sold by
Carey Patrick J
Bought by
Spivey Kyle E and Spivey Jenny L
Home Financials for this Owner
Home Financials are based on the most recent Mortgage that was taken out on this home.
Original Mortgage
$132,456
Interest Rate
3.25%
Mortgage Type
FHA
Purchase Details
Closed on
May 14, 2008
Sold by
Whiteside Cathie E
Bought by
Carey Patrick J
Home Financials for this Owner
Home Financials are based on the most recent Mortgage that was taken out on this home.
Original Mortgage
$50,000
Interest Rate
5.86%
Purchase Details
Closed on
Nov 20, 2001
Sold by
Goodall Inc Builders
Bought by
Whiteside Cathie E
Purchase Details
Closed on
Oct 15, 2001
Bought by
Goodall Inc Builders
Create a Home Valuation Report for This Property
The Home Valuation Report is an in-depth analysis detailing your home's value as well as a comparison with similar homes in the area
Home Values in the Area
Average Home Value in this Area
Purchase History
| Date | Buyer | Sale Price | Title Company |
|---|---|---|---|
| Ledford Jeremy C | $157,000 | None Available | |
| Spivey Kyle E | $134,900 | -- | |
| Carey Patrick J | $150,000 | -- | |
| Whiteside Cathie E | -- | -- | |
| Goodall Inc Builders | $15,000 | -- |
Source: Public Records
Mortgage History
| Date | Status | Borrower | Loan Amount |
|---|---|---|---|
| Previous Owner | Spivey Kyle E | $132,456 | |
| Previous Owner | Goodall Inc Builders | $50,000 |
Source: Public Records
Tax History Compared to Growth
Tax History
| Year | Tax Paid | Tax Assessment Tax Assessment Total Assessment is a certain percentage of the fair market value that is determined by local assessors to be the total taxable value of land and additions on the property. | Land | Improvement |
|---|---|---|---|---|
| 2024 | -- | $68,125 | $18,750 | $49,375 |
| 2023 | $1,787 | $68,125 | $18,750 | $49,375 |
| 2022 | $1,460 | $37,800 | $5,750 | $32,050 |
| 2021 | $1,460 | $37,800 | $5,750 | $32,050 |
| 2020 | $1,366 | $37,800 | $5,750 | $32,050 |
| 2019 | $1,366 | $37,800 | $5,750 | $32,050 |
| 2018 | $1,364 | $37,800 | $5,750 | $32,050 |
| 2017 | $1,384 | $32,050 | $4,550 | $27,500 |
| 2016 | $1,384 | $32,050 | $4,550 | $27,500 |
| 2015 | $1,343 | $32,050 | $4,550 | $27,500 |
| 2014 | $1,343 | $32,050 | $4,550 | $27,500 |
Source: Public Records
Map
Nearby Homes
- 7039 Sutton Dr
- 7054 Sutton Dr
- 7092 Sutton Dr
- 7030 Sutton Dr
- 7022 Sutton Dr
- 9163 Gant Dr
- 102 Williamsburg Dr
- 311 Orchard Park Dr
- 7060 Sutton Dr
- 7086 Sutton Dr
- 2655 Sutton Dr
- 2384 Sutton Dr
- 2278 Sutton Dr
- 1972 Sutton Dr
- 1556 Sutton Dr
- 1428 Sutton Dr
- 2155 Sutton Dr
- 7131 Sutton Dr
- 9167 Gant Dr
- 7112 Sutton Dr
- 920 Chesire Ct
- 916 Chesire Ct
- 922 Chesire Ct
- 914 Chesire Ct
- 908 Chesire Ct
- 906 Chesire Ct
- 1010 Picadilly Dr
- 912 Chesire Ct
- 904 Chesire Ct
- 910 Chesire Ct
- 103 Apple Ct
- 1014 Picadilly Dr
- 205 Dorchester Dr
- 209 Dorchester Dr
- 203 Dorchester Dr
- 1015 Picadilly Dr
- 201 Dorchester Dr
- 101 Apple Ct
- 104 Apple Ct
- 204 Orchard Park Dr