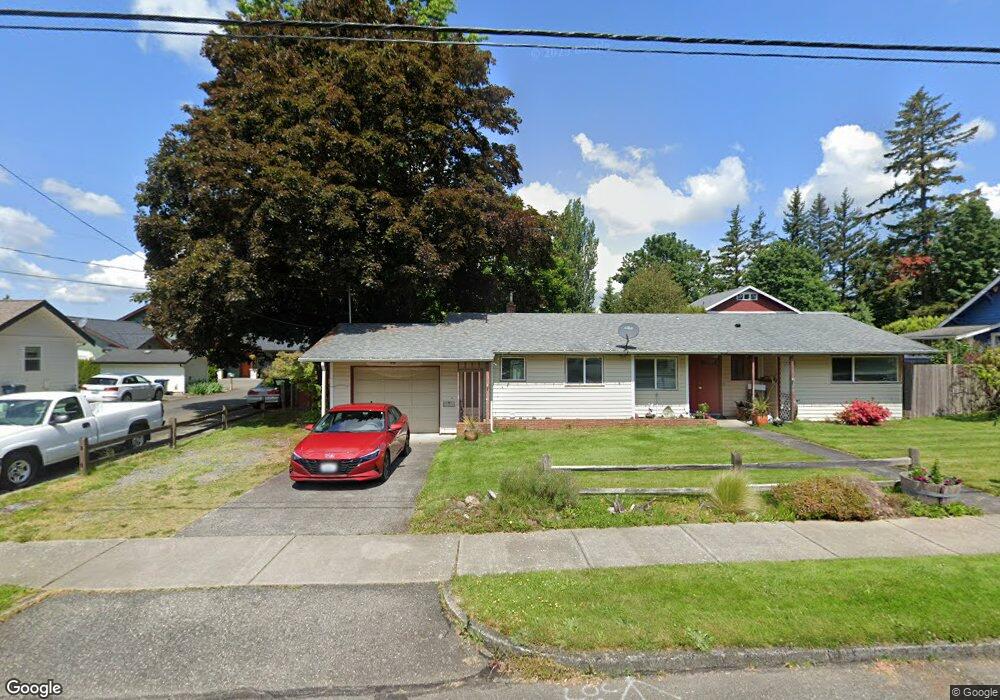
918 Glenning St Lynden, WA 98264
Estimated Value: $695,000 - $794,000
4
Beds
2
Baths
3,432
Sq Ft
$217/Sq Ft
Est. Value
About This Home
This home is located at 918 Glenning St, Lynden, WA 98264 and is currently estimated at $743,310, approximately $216 per square foot. 918 Glenning St is a home located in Whatcom County with nearby schools including Lynden High School, Lynden Christian School, and Lynden Christian Schools: Administration.
Ownership History
Date
Name
Owned For
Owner Type
Purchase Details
Closed on
Apr 23, 2024
Sold by
Vanderyacht Jeffrey W and Vanderyacht Colleen D
Bought by
Jeffrey And Colleen Vanderyacht Living Trust and Vanderyacht
Current Estimated Value
Purchase Details
Closed on
Jul 12, 2011
Sold by
Whitehead Brent E and Whitehead Sara E
Bought by
Vander Yacht Jeffrey W and Vander Yacht Colleen D
Home Financials for this Owner
Home Financials are based on the most recent Mortgage that was taken out on this home.
Original Mortgage
$280,000
Interest Rate
4.5%
Mortgage Type
New Conventional
Purchase Details
Closed on
Jul 23, 2007
Sold by
Dejong Brad and Dejong Jeanne L
Bought by
Whitehead Brent E and Whitehead Sara E
Home Financials for this Owner
Home Financials are based on the most recent Mortgage that was taken out on this home.
Original Mortgage
$52,500
Interest Rate
6.66%
Mortgage Type
Stand Alone Second
Create a Home Valuation Report for This Property
The Home Valuation Report is an in-depth analysis detailing your home's value as well as a comparison with similar homes in the area
Home Values in the Area
Average Home Value in this Area
Purchase History
| Date | Buyer | Sale Price | Title Company |
|---|---|---|---|
| Jeffrey And Colleen Vanderyacht Living Trust | $313 | None Listed On Document | |
| Vander Yacht Jeffrey W | $350,280 | Chicago Title Insurance | |
| Whitehead Brent E | $350,280 | First American Title Insuran |
Source: Public Records
Mortgage History
| Date | Status | Borrower | Loan Amount |
|---|---|---|---|
| Previous Owner | Vander Yacht Jeffrey W | $280,000 | |
| Previous Owner | Whitehead Brent E | $52,500 | |
| Previous Owner | Whitehead Brent E | $280,000 |
Source: Public Records
Tax History Compared to Growth
Tax History
| Year | Tax Paid | Tax Assessment Tax Assessment Total Assessment is a certain percentage of the fair market value that is determined by local assessors to be the total taxable value of land and additions on the property. | Land | Improvement |
|---|---|---|---|---|
| 2024 | $4,815 | $674,807 | $272,813 | $401,994 |
| 2023 | $4,815 | $667,783 | $281,250 | $386,533 |
| 2022 | $4,657 | $609,252 | $198,561 | $410,691 |
| 2021 | $4,568 | $503,508 | $164,098 | $339,410 |
| 2020 | $4,004 | $449,573 | $146,520 | $303,053 |
| 2019 | $3,564 | $412,328 | $134,530 | $277,798 |
| 2018 | $3,894 | $376,028 | $122,551 | $253,477 |
| 2017 | $3,607 | $337,517 | $110,000 | $227,517 |
| 2016 | $3,408 | $332,421 | $107,800 | $224,621 |
| 2015 | $3,022 | $312,282 | $103,684 | $208,598 |
| 2014 | -- | $301,700 | $100,156 | $201,544 |
| 2013 | -- | $299,544 | $98,000 | $201,544 |
Source: Public Records
Map
Nearby Homes
- 410 10th St
- 908 Liberty St
- 0 Guide Meridian Unit NWM2369980
- 1584 Main St
- 518 Edson St
- 735 Ivy St
- 915 Front St
- 1218 Front St
- 403 17th St
- 515 17th St
- 706 Judson St Unit B
- 706 Judson St Unit A
- 1510 E St
- 805 Cedar Dr
- 301 S Park St
- 104 Riverwalk Dr
- 102 Riverwalk Dr
- 208 Riverwalk Dr
- 2016 Steelhead Way
- 1717 E St
- 1004 Glenning St
- 910 Glenning St
- 916 Glenning St
- 912 Glenning St
- 1008 Glenning St
- 123 Pine St
- 849 Main St
- 513 Main Place
- 515 Main Place Unit D
- 515 Main Place Unit C
- 515 Main Place Unit B
- 515 Main Place Unit A
- 515 Main Place
- 515 Main Place Unit 98264
- 841 Main St
- 1020 Glenning St
- 851 Main St
- 414 10th St
- 822 Glenning St
- 511 Main Place