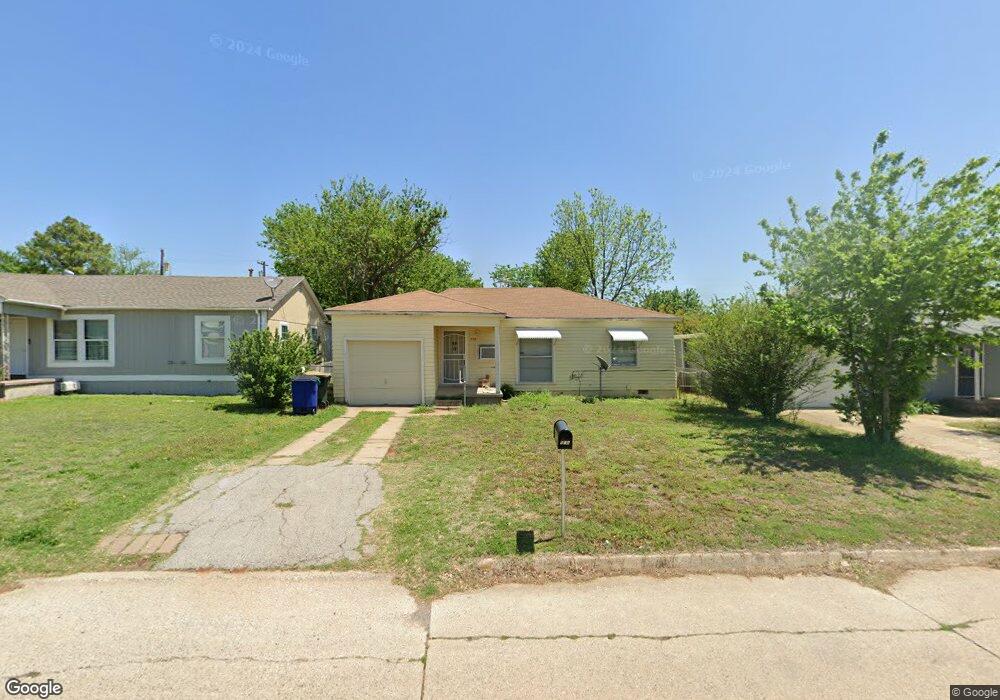
918 N B St Duncan, OK 73533
Estimated Value: $44,000 - $47,000
2
Beds
1
Bath
830
Sq Ft
$55/Sq Ft
Est. Value
About This Home
This home is located at 918 N B St, Duncan, OK 73533 and is currently estimated at $45,672, approximately $55 per square foot. 918 N B St is a home located in Stephens County with nearby schools including Woodrow Wilson Elementary School, Duncan Middle School, and Duncan High School.
Ownership History
Date
Name
Owned For
Owner Type
Purchase Details
Closed on
Aug 29, 2020
Sold by
Perry Gena Mariea and Perry Ryan Layne
Bought by
Ace Properties Llc
Current Estimated Value
Home Financials for this Owner
Home Financials are based on the most recent Mortgage that was taken out on this home.
Original Mortgage
$21,829
Outstanding Balance
$11,549
Interest Rate
3%
Mortgage Type
Future Advance Clause Open End Mortgage
Estimated Equity
$34,123
Purchase Details
Closed on
May 21, 2004
Sold by
Patterson Steve and Patterson Susan
Bought by
Perry Ryan Layne and Perry Gena M
Purchase Details
Closed on
Jun 10, 2003
Sold by
Coulston Kenny Shawn
Purchase Details
Closed on
Dec 31, 1992
Sold by
Tate Lorene
Create a Home Valuation Report for This Property
The Home Valuation Report is an in-depth analysis detailing your home's value as well as a comparison with similar homes in the area
Home Values in the Area
Average Home Value in this Area
Purchase History
| Date | Buyer | Sale Price | Title Company |
|---|---|---|---|
| Ace Properties Llc | $20,000 | Stephens Co Abstract Co | |
| Perry Ryan Layne | $152,000 | -- | |
| -- | $21,500 | -- | |
| -- | $19,000 | -- |
Source: Public Records
Mortgage History
| Date | Status | Borrower | Loan Amount |
|---|---|---|---|
| Open | Ace Properties Llc | $21,829 |
Source: Public Records
Tax History Compared to Growth
Tax History
| Year | Tax Paid | Tax Assessment Tax Assessment Total Assessment is a certain percentage of the fair market value that is determined by local assessors to be the total taxable value of land and additions on the property. | Land | Improvement |
|---|---|---|---|---|
| 2025 | $231 | $2,743 | $356 | $2,387 |
| 2024 | $222 | $2,612 | $356 | $2,256 |
| 2023 | $222 | $2,612 | $356 | $2,256 |
| 2022 | $201 | $2,488 | $356 | $2,132 |
| 2021 | $192 | $2,257 | $356 | $1,901 |
| 2020 | $197 | $2,279 | $356 | $1,923 |
| 2019 | $188 | $2,170 | $356 | $1,814 |
| 2018 | $184 | $2,067 | $356 | $1,711 |
| 2017 | $198 | $2,300 | $356 | $1,944 |
| 2016 | $287 | $3,382 | $356 | $3,026 |
| 2015 | $264 | $3,221 | $356 | $2,865 |
| 2014 | $264 | $3,068 | $356 | $2,712 |
Source: Public Records
Map
Nearby Homes