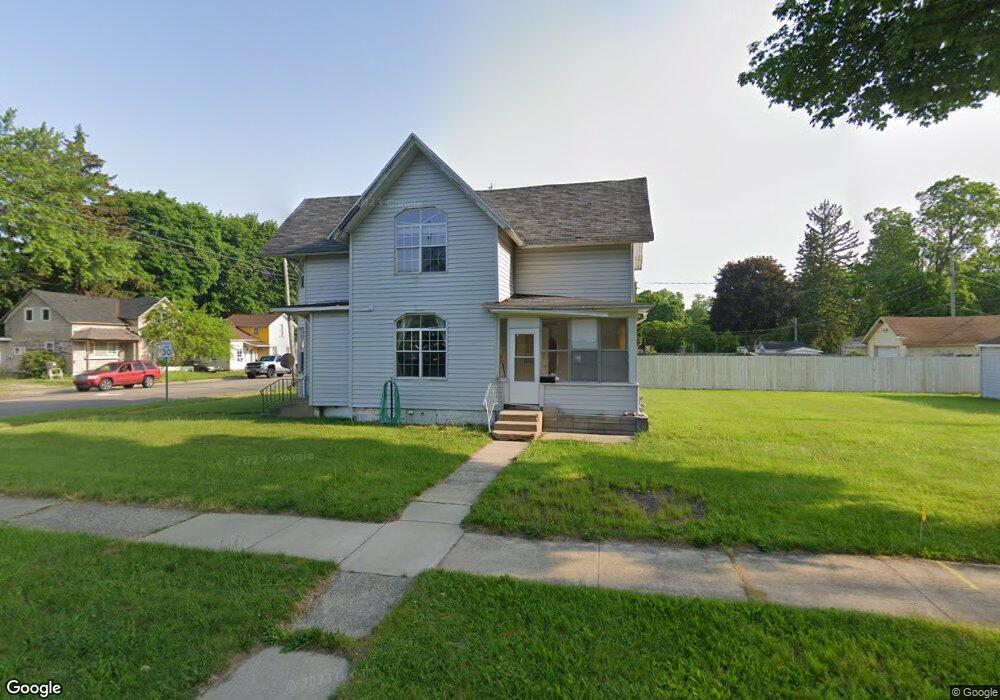
918 S Main St Three Rivers, MI 49093
Estimated Value: $127,000 - $154,000
4
Beds
1
Bath
1,272
Sq Ft
$109/Sq Ft
Est. Value
About This Home
This home is located at 918 S Main St, Three Rivers, MI 49093 and is currently estimated at $138,324, approximately $108 per square foot. 918 S Main St is a home located in St. Joseph County with nearby schools including Immaculate Conception School and Heartwood Renaissance Academy.
Ownership History
Date
Name
Owned For
Owner Type
Purchase Details
Closed on
Mar 4, 2020
Sold by
Sedore Shawn E
Bought by
Bartlett Nathanial
Current Estimated Value
Home Financials for this Owner
Home Financials are based on the most recent Mortgage that was taken out on this home.
Original Mortgage
$81,480
Outstanding Balance
$72,162
Interest Rate
3.5%
Mortgage Type
New Conventional
Estimated Equity
$66,162
Purchase Details
Closed on
Jul 3, 2003
Sold by
Lee Mark and Lee Carla
Bought by
Wachovia Bank Na
Purchase Details
Closed on
Aug 21, 2001
Purchase Details
Closed on
Dec 22, 1999
Sold by
Hoffine
Bought by
Hough
Purchase Details
Closed on
Jan 1, 1983
Sold by
Us Department Of Agriculture
Bought by
Hoffine Harold L and Hoffine Mary A
Create a Home Valuation Report for This Property
The Home Valuation Report is an in-depth analysis detailing your home's value as well as a comparison with similar homes in the area
Home Values in the Area
Average Home Value in this Area
Purchase History
| Date | Buyer | Sale Price | Title Company |
|---|---|---|---|
| Bartlett Nathanial | $84,000 | Oak Title Services Llc | |
| Wachovia Bank Na | $65,800 | -- | |
| -- | -- | -- | |
| Hough | $44,500 | -- | |
| Hoffine Harold L | $12,000 | -- |
Source: Public Records
Mortgage History
| Date | Status | Borrower | Loan Amount |
|---|---|---|---|
| Open | Bartlett Nathanial | $81,480 |
Source: Public Records
Tax History Compared to Growth
Tax History
| Year | Tax Paid | Tax Assessment Tax Assessment Total Assessment is a certain percentage of the fair market value that is determined by local assessors to be the total taxable value of land and additions on the property. | Land | Improvement |
|---|---|---|---|---|
| 2025 | $2,024 | $63,500 | $4,300 | $59,200 |
| 2024 | $1,333 | $55,800 | $2,800 | $53,000 |
| 2023 | $1,270 | $46,600 | $2,900 | $43,700 |
| 2022 | $1,210 | $41,100 | $2,900 | $38,200 |
| 2021 | $1,780 | $39,100 | $2,900 | $36,200 |
| 2020 | $1,151 | $34,800 | $2,700 | $32,100 |
| 2019 | $1,130 | $31,700 | $2,300 | $29,400 |
| 2018 | $1,073 | $28,500 | $4,300 | $24,200 |
| 2017 | $1,057 | $26,900 | $26,900 | $0 |
| 2016 | -- | $26,700 | $26,700 | $0 |
| 2015 | -- | $26,400 | $0 | $0 |
| 2014 | -- | $27,800 | $27,800 | $0 |
| 2012 | -- | $27,100 | $27,100 | $0 |
Source: Public Records
Map
Nearby Homes