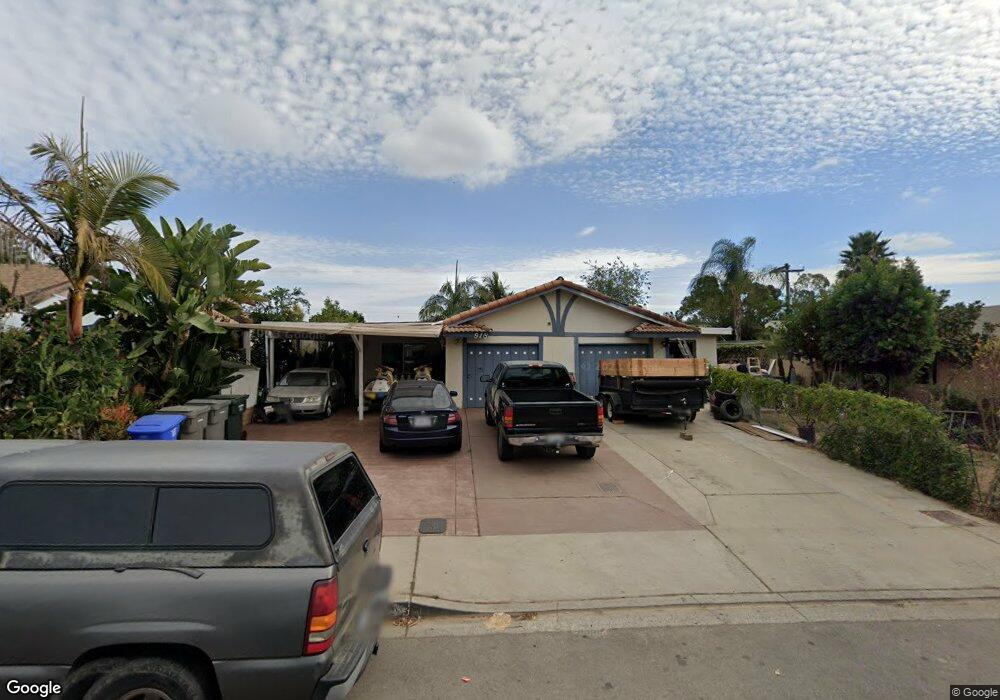
918 S Wisconsin St Unit 20 Fallbrook, CA 92028
Estimated Value: $640,206 - $891,000
6
Beds
2
Baths
1,654
Sq Ft
$462/Sq Ft
Est. Value
About This Home
This home is located at 918 S Wisconsin St Unit 20, Fallbrook, CA 92028 and is currently estimated at $764,052, approximately $461 per square foot. 918 S Wisconsin St Unit 20 is a home located in San Diego County with nearby schools including Fallbrook STEM Academy, James E. Potter Intermediate School, and Fallbrook High School.
Ownership History
Date
Name
Owned For
Owner Type
Purchase Details
Closed on
Jul 1, 2010
Sold by
Rinker Patricia
Bought by
Rinker Patrick
Current Estimated Value
Purchase Details
Closed on
Aug 27, 1997
Sold by
Federal Home Loan Mortgage Corporation
Bought by
Garcia Jesus and Garcia Maria
Home Financials for this Owner
Home Financials are based on the most recent Mortgage that was taken out on this home.
Original Mortgage
$106,023
Outstanding Balance
$16,402
Interest Rate
7.45%
Mortgage Type
FHA
Estimated Equity
$747,650
Purchase Details
Closed on
Jan 7, 1997
Sold by
Pff Bank & Trust
Bought by
Federal Home Loan Mortgage Corporation
Purchase Details
Closed on
Nov 20, 1996
Sold by
Daniel Gluck
Bought by
Pff Bank & Trust
Purchase Details
Closed on
Dec 22, 1989
Purchase Details
Closed on
Aug 1, 1985
Create a Home Valuation Report for This Property
The Home Valuation Report is an in-depth analysis detailing your home's value as well as a comparison with similar homes in the area
Home Values in the Area
Average Home Value in this Area
Purchase History
| Date | Buyer | Sale Price | Title Company |
|---|---|---|---|
| Rinker Patrick | -- | None Available | |
| Garcia Jesus | $107,000 | First American Title | |
| Federal Home Loan Mortgage Corporation | -- | Chicago Title | |
| Pff Bank & Trust | $103,139 | Chicago Title | |
| -- | $166,500 | -- | |
| -- | $100,000 | -- |
Source: Public Records
Mortgage History
| Date | Status | Borrower | Loan Amount |
|---|---|---|---|
| Open | Garcia Jesus | $106,023 |
Source: Public Records
Tax History Compared to Growth
Tax History
| Year | Tax Paid | Tax Assessment Tax Assessment Total Assessment is a certain percentage of the fair market value that is determined by local assessors to be the total taxable value of land and additions on the property. | Land | Improvement |
|---|---|---|---|---|
| 2025 | $1,821 | $170,826 | $79,824 | $91,002 |
| 2024 | $1,821 | $167,477 | $78,259 | $89,218 |
| 2023 | $1,776 | $164,194 | $76,725 | $87,469 |
| 2022 | $1,776 | $160,975 | $75,221 | $85,754 |
| 2021 | $1,728 | $157,820 | $73,747 | $84,073 |
| 2020 | $1,747 | $156,202 | $72,991 | $83,211 |
| 2019 | $1,720 | $153,140 | $71,560 | $81,580 |
| 2018 | $1,695 | $150,138 | $70,157 | $79,981 |
| 2017 | $1,662 | $147,195 | $68,782 | $78,413 |
| 2016 | $1,620 | $144,310 | $67,434 | $76,876 |
| 2015 | $1,581 | $142,144 | $66,422 | $75,722 |
| 2014 | $1,552 | $139,360 | $65,121 | $74,239 |
Source: Public Records
Map
Nearby Homes
- 522 S Pico Ave
- 127 E College St
- 212 S Wisconsin St
- 1206 Old Stage Rd
- 720 W Fig St
- 1455 Alturas Rd Unit 55
- 435 W Hawthorne St
- 203 Rhesa Ln
- 502 E Elder St
- 508 Village View Place
- 728 Hackberry Place
- 503 Potter St
- 0 Laurine Ln
- 1018 Morro Rd
- 710 Ceramic Ln
- 251 Royal Glen Dr
- 1714 Woodlark Ln
- 705 Old Bridge Rd
- 425 E Dougherty St
- 214 Deddie Terrace
- 930 S Wisconsin St Unit 32
- 904 S Wisconsin St Unit 6
- 944 S Wisconsin St Unit 46
- 860 S Wisconsin St Unit 62
- 915 S Wisconsin St Unit 17
- 927 S Wisconsin St
- 927 S Wisconsin Ave
- 903 S Wisconsin St Unit 5
- 846 S Wisconsin St Unit 48
- 952 S Wisconsin St Unit 54
- 945 S Wisconsin St Unit 47
- 853 S Wisconsin St Unit 55
- 935 S Wisconsin St Unit 37
- 834 S Wisconsin St Unit 36
- 953 S Wisconsin St Unit 55
- 935 S Wisconsin St
- 937 S Wisconsin St
- 508 Teran Dr
- 461 W Aviation Rd Unit 63
- 822 S Wisconsin St