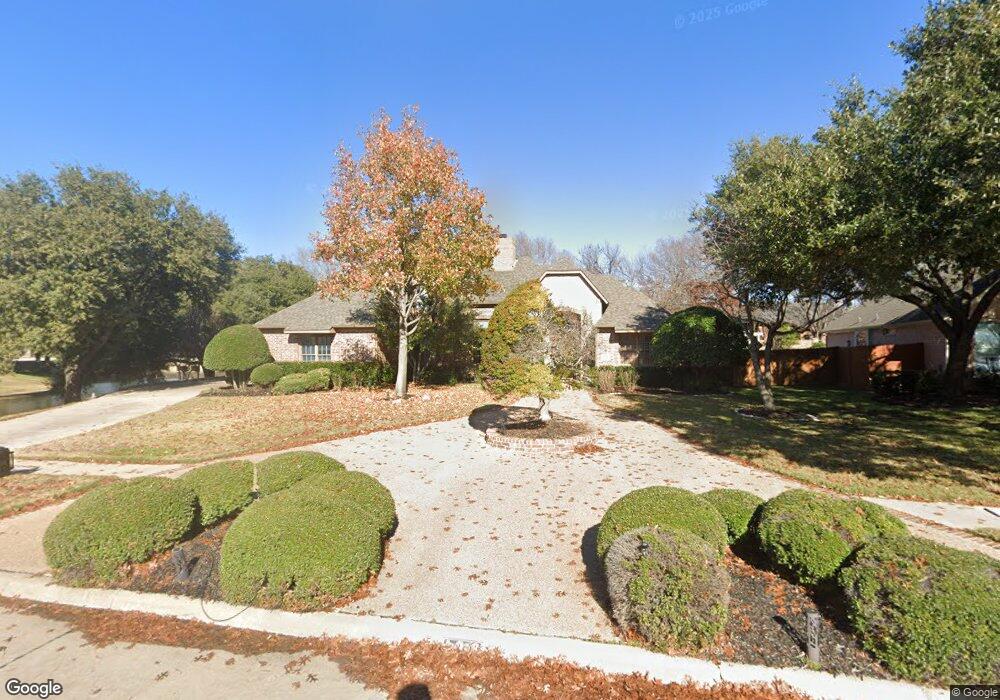
918 Stratford Dr Southlake, TX 76092
Estimated Value: $1,032,000 - $1,162,000
4
Beds
4
Baths
3,832
Sq Ft
$290/Sq Ft
Est. Value
About This Home
This home is located at 918 Stratford Dr, Southlake, TX 76092 and is currently estimated at $1,109,875, approximately $289 per square foot. 918 Stratford Dr is a home located in Tarrant County with nearby schools including Carroll Elementary School, Eubanks Intermediate School, and George Dawson Middle School.
Ownership History
Date
Name
Owned For
Owner Type
Purchase Details
Closed on
Aug 27, 2020
Sold by
Brunig Mary A and Estate Of Robert Brunig
Bought by
Kim Jaehyup and Jeong Hyeyeon
Current Estimated Value
Home Financials for this Owner
Home Financials are based on the most recent Mortgage that was taken out on this home.
Original Mortgage
$608,000
Outstanding Balance
$539,560
Interest Rate
2.9%
Mortgage Type
New Conventional
Estimated Equity
$570,315
Purchase Details
Closed on
Feb 2, 1998
Sold by
Sanders Custom Builder Ltd
Bought by
Brunig Robert A
Home Financials for this Owner
Home Financials are based on the most recent Mortgage that was taken out on this home.
Original Mortgage
$215,000
Interest Rate
6.98%
Create a Home Valuation Report for This Property
The Home Valuation Report is an in-depth analysis detailing your home's value as well as a comparison with similar homes in the area
Home Values in the Area
Average Home Value in this Area
Purchase History
| Date | Buyer | Sale Price | Title Company |
|---|---|---|---|
| Kim Jaehyup | -- | Fidelity National | |
| Brunig Robert A | -- | American Title |
Source: Public Records
Mortgage History
| Date | Status | Borrower | Loan Amount |
|---|---|---|---|
| Open | Kim Jaehyup | $608,000 | |
| Previous Owner | Brunig Robert A | $215,000 |
Source: Public Records
Tax History Compared to Growth
Tax History
| Year | Tax Paid | Tax Assessment Tax Assessment Total Assessment is a certain percentage of the fair market value that is determined by local assessors to be the total taxable value of land and additions on the property. | Land | Improvement |
|---|---|---|---|---|
| 2025 | $12,992 | $864,138 | $355,500 | $508,638 |
| 2024 | $12,992 | $985,386 | $355,500 | $629,886 |
| 2023 | $14,335 | $1,002,340 | $355,500 | $646,840 |
| 2022 | $15,425 | $830,000 | $237,000 | $593,000 |
| 2021 | $14,820 | $650,000 | $237,000 | $413,000 |
| 2020 | $16,318 | $709,923 | $213,300 | $496,623 |
| 2019 | $17,345 | $716,287 | $187,500 | $528,787 |
| 2018 | $15,016 | $658,660 | $168,750 | $489,910 |
| 2017 | $15,311 | $617,733 | $148,500 | $469,233 |
| 2016 | $14,499 | $584,945 | $148,500 | $436,445 |
| 2015 | $12,167 | $534,885 | $121,500 | $413,385 |
| 2014 | $12,167 | $503,700 | $74,250 | $429,450 |
Source: Public Records
Map
Nearby Homes
- 305 Sheffield Dr
- 806 Ridgedale Ct
- 203 Manor Place
- 102 Springbrook Ct
- 806 Shadow Glen Dr
- 300 Shady Oaks Dr
- 800 Woodcrest Ct
- 204 Southridge Lakes Pkwy
- 608 Stratford Dr
- 403 Presidio Ct
- 305 Canyon Lake Dr
- 205 Edinburgh Ct
- 203 Donley Ct
- 810 Brazos Dr
- 2530 & 2580 W Southlake Blvd
- 550 N Peytonville Ave
- 207 Killdeer Trail
- 351 S White Chapel Blvd
- 802 Princeton Ct
- 503 Indian Paintbrush Way
- 916 Stratford Dr
- 914 Stratford Dr
- 912 Stratford Dr
- 103 Regent Ct
- 704 Essex Ct
- 1101 Stone Lakes Dr
- 702 Essex Ct
- 101 Regent Ct
- 910 Stratford Dr
- 706 Essex Ct
- 1103 Stone Lakes Dr
- 100 Regent Ct
- 700 Essex Ct
- 908 Stratford Dr
- 916 Stacy Dr
- 803 W Southlake Blvd
- 803 W Southlake Blvd Unit 140
- 1108 Normandy Dr
- 104 Regent Ct
- 708 Essex Ct