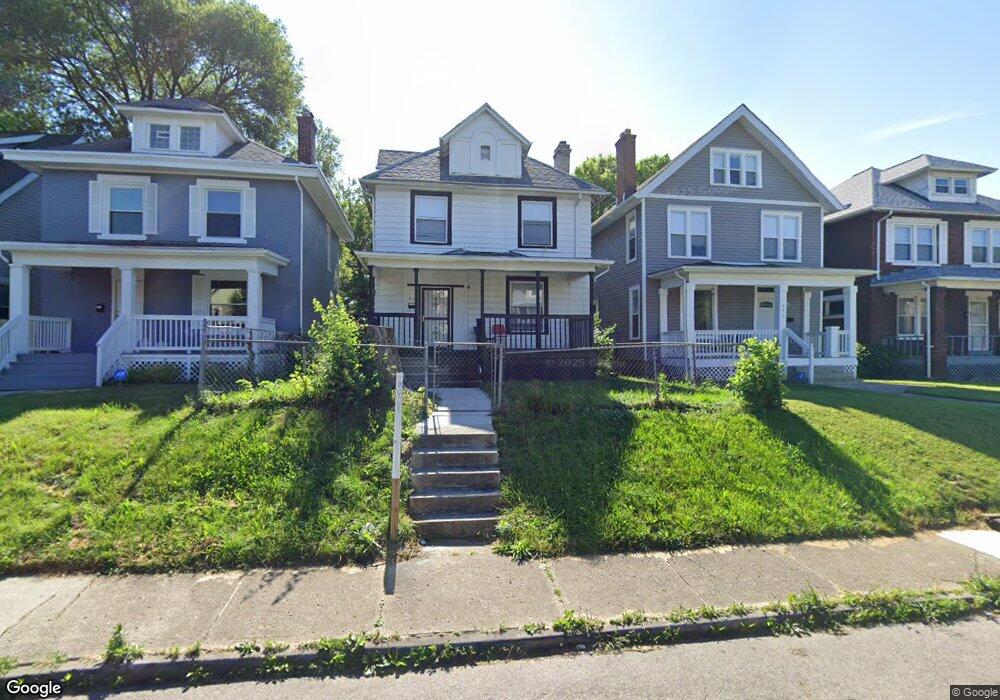
918 Studer Ave Columbus, OH 43206
Driving Park NeighborhoodEstimated Value: $208,291 - $269,000
3
Beds
2
Baths
1,628
Sq Ft
$143/Sq Ft
Est. Value
About This Home
This home is located at 918 Studer Ave, Columbus, OH 43206 and is currently estimated at $232,073, approximately $142 per square foot. 918 Studer Ave is a home located in Franklin County with nearby schools including Livingston Elementary School, South High School, and Capital Collegiate Preparatory Academy.
Ownership History
Date
Name
Owned For
Owner Type
Purchase Details
Closed on
Sep 20, 2006
Sold by
Countrywide Home Loans Inc
Bought by
Martin William
Current Estimated Value
Purchase Details
Closed on
Jul 15, 2005
Sold by
Dravis Regina M and Woycitzky Abby
Bought by
Countrywide Home Loans Inc
Purchase Details
Closed on
Jun 2, 2003
Sold by
Green Donald F and Green Brenda H
Bought by
Woycitzky Abby and Davis Regina M
Home Financials for this Owner
Home Financials are based on the most recent Mortgage that was taken out on this home.
Original Mortgage
$82,450
Interest Rate
7.44%
Mortgage Type
Purchase Money Mortgage
Purchase Details
Closed on
Mar 10, 1999
Sold by
Hud
Bought by
Green Donald F
Home Financials for this Owner
Home Financials are based on the most recent Mortgage that was taken out on this home.
Original Mortgage
$40,000
Interest Rate
6.94%
Purchase Details
Closed on
Oct 8, 1998
Sold by
Williams Ezell Jr and Lasalle Home Mtg Corp
Bought by
Hud
Purchase Details
Closed on
May 1, 1980
Create a Home Valuation Report for This Property
The Home Valuation Report is an in-depth analysis detailing your home's value as well as a comparison with similar homes in the area
Home Values in the Area
Average Home Value in this Area
Purchase History
| Date | Buyer | Sale Price | Title Company |
|---|---|---|---|
| Martin William | $29,900 | Resource T | |
| Countrywide Home Loans Inc | -- | -- | |
| Woycitzky Abby | $97,000 | -- | |
| Green Donald F | -- | -- | |
| Hud | $33,356 | -- | |
| -- | $7,000 | -- |
Source: Public Records
Mortgage History
| Date | Status | Borrower | Loan Amount |
|---|---|---|---|
| Previous Owner | Woycitzky Abby | $82,450 | |
| Previous Owner | Green Donald F | $40,000 |
Source: Public Records
Tax History
| Year | Tax Paid | Tax Assessment Tax Assessment Total Assessment is a certain percentage of the fair market value that is determined by local assessors to be the total taxable value of land and additions on the property. | Land | Improvement |
|---|---|---|---|---|
| 2025 | $2,986 | $66,540 | $28,530 | $38,010 |
| 2024 | $2,986 | $66,540 | $28,530 | $38,010 |
| 2023 | $2,948 | $66,535 | $28,525 | $38,010 |
| 2022 | $1,271 | $24,500 | $5,110 | $19,390 |
| 2021 | $1,419 | $24,500 | $5,110 | $19,390 |
| 2020 | $1,399 | $24,500 | $5,110 | $19,390 |
| 2019 | $1,117 | $18,420 | $3,960 | $14,460 |
| 2018 | $1,071 | $18,420 | $3,960 | $14,460 |
| 2017 | $2,638 | $18,420 | $3,960 | $14,460 |
| 2016 | $4,160 | $14,110 | $3,500 | $10,610 |
| 2015 | $848 | $14,110 | $3,500 | $10,610 |
| 2014 | $851 | $14,110 | $3,500 | $10,610 |
| 2013 | $442 | $14,840 | $3,675 | $11,165 |
Source: Public Records
Map
Nearby Homes
- 895 Studer Ave
- 901 Lockbourne Rd
- 1005 Studer Ave
- 911 Linwood Ave Unit & 913
- 974 Miller Ave
- 980 Miller Ave
- 1038 Lockbourne Rd
- 928 Miller Ave
- 916 Miller Ave
- 946 Wilson Ave
- 1036 Miller Ave
- 1225 E Livingston Ave
- 1060-1062 Linwood Ave
- 1062 Miller Ave
- 910 Ellsworth Ave
- 959 Kelton Ave
- 831 Wilson Ave
- 1035 Wilson Ave
- 1165-1167 E Whittier St
- 889 Kelton Ave
- 914 Studer Ave
- 922 Studer Ave
- 926-928 Studer Ave
- 926 Studer Ave Unit 928
- 904 Studer Ave
- 900 Studer Ave
- 898 Studer Ave
- 925 Lockbourne Rd
- 929 Lockbourne Rd
- 936-942 Studer Ave
- 1231 Forest St
- 936 Studer Avenue 75 Ave Unit 938,940,942
- 933 Lockbourne Rd
- 917 Lockbourne Rd Unit 919
- 917-919 Lockbourne Rd Unit 917 - 919
- 917-919 Lockbourne Rd
- 923 Studer Ave
- 940 Studer Ave
- 913 Lockbourne Rd
- 921 Lockbourne Rd Unit 923
Your Personal Tour Guide
Ask me questions while you tour the home.