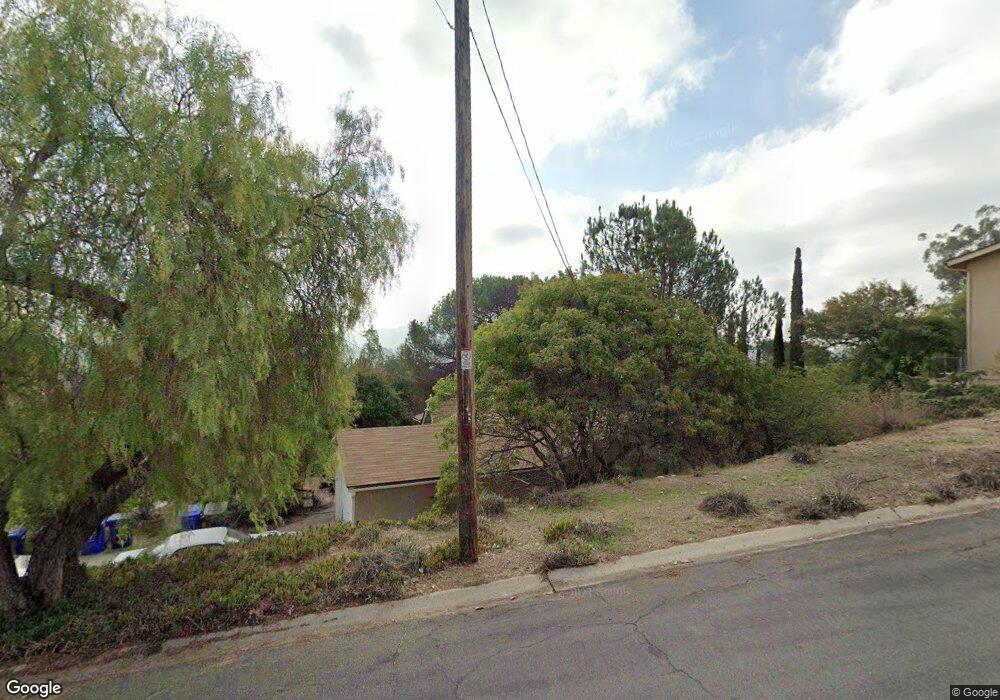
9185 Altamont Rd La Mesa, CA 91942
Fletcher Hills NeighborhoodEstimated Value: $740,000 - $840,000
3
Beds
2
Baths
1,104
Sq Ft
$711/Sq Ft
Est. Value
About This Home
This home is located at 9185 Altamont Rd, La Mesa, CA 91942 and is currently estimated at $785,477, approximately $711 per square foot. 9185 Altamont Rd is a home located in San Diego County with nearby schools including Northmont Elementary School, Parkway Academy, and West Hills High School.
Ownership History
Date
Name
Owned For
Owner Type
Purchase Details
Closed on
Sep 28, 2005
Sold by
John J Brady 1998 Trust
Bought by
Goddard Carol
Current Estimated Value
Purchase Details
Closed on
Sep 22, 1998
Sold by
Brady Barbara K
Bought by
Brady John J
Purchase Details
Closed on
Jul 14, 1998
Sold by
Brady John J
Bought by
Brady John J
Purchase Details
Closed on
Jun 30, 1998
Sold by
Goddard Carol A
Bought by
Brady John J
Purchase Details
Closed on
Jun 22, 1998
Sold by
Armstrong Monica B
Bought by
Brady John J
Create a Home Valuation Report for This Property
The Home Valuation Report is an in-depth analysis detailing your home's value as well as a comparison with similar homes in the area
Home Values in the Area
Average Home Value in this Area
Purchase History
| Date | Buyer | Sale Price | Title Company |
|---|---|---|---|
| Goddard Carol | -- | -- | |
| Brady John J | -- | -- | |
| Brady John J | -- | -- | |
| Brady John J | -- | -- | |
| Brady John J | -- | -- |
Source: Public Records
Tax History Compared to Growth
Tax History
| Year | Tax Paid | Tax Assessment Tax Assessment Total Assessment is a certain percentage of the fair market value that is determined by local assessors to be the total taxable value of land and additions on the property. | Land | Improvement |
|---|---|---|---|---|
| 2025 | $1,268 | $82,086 | $36,706 | $45,380 |
| 2024 | $1,268 | $80,478 | $35,987 | $44,491 |
| 2023 | $1,215 | $78,901 | $35,282 | $43,619 |
| 2022 | $1,188 | $77,355 | $34,591 | $42,764 |
| 2021 | $1,157 | $75,839 | $33,913 | $41,926 |
| 2020 | $1,116 | $75,063 | $33,566 | $41,497 |
| 2019 | $1,084 | $73,592 | $32,908 | $40,684 |
| 2018 | $1,054 | $72,150 | $32,263 | $39,887 |
| 2017 | $50 | $70,736 | $31,631 | $39,105 |
| 2016 | $1,002 | $69,350 | $31,011 | $38,339 |
| 2015 | $1,008 | $68,310 | $30,546 | $37,764 |
| 2014 | $1,005 | $66,973 | $29,948 | $37,025 |
Source: Public Records
Map
Nearby Homes
- 282 Garfield Ave
- 9348 Horton Dr
- 363 Garden Grove Ln
- 6130 Howell Dr
- 2213 Chatham St
- 5654 Amaya Dr Unit 150
- 8767 Blue Lake Dr
- 6428 Lake Apopka Place
- 6232 Lake Athabaska Place
- 198 Croydon Ln
- 1894 Wedgemere Rd
- 5931 Howell Dr Unit 9
- 5931 Howell Dr Unit 14
- 5750 Amaya Dr Unit 10
- 700 Wakefield Ct
- 5995 Broadmoor Dr
- 8721 Lake Murray Blvd Unit 1
- 8717 Navajo Rd Unit 1
- 8671 Lake Murray Blvd Unit 4
- 8765 Lake Murray Blvd Unit 3
- 9179 Altamont Rd
- 6360 Blanchard Rd
- 6370 Blanchard Rd
- 6350 Blanchard Rd
- 9180 Altamont Rd
- 9186 Altamont Rd
- 6380 Blanchard Rd
- 9175 Altamont Rd
- 6400 Sommer Place
- 9190 Altamont Rd
- 6340 Blanchard Rd
- 6411 Sommer Place
- 104 Blanchard Rd
- 6410 Sommer Place
- 9145 Altamont Rd
- 6421 Sommer Place
- 122 Blanchard Rd
- 6365 Blanchard Rd
- 6375 Blanchard Rd
- 6420 Sommer Place