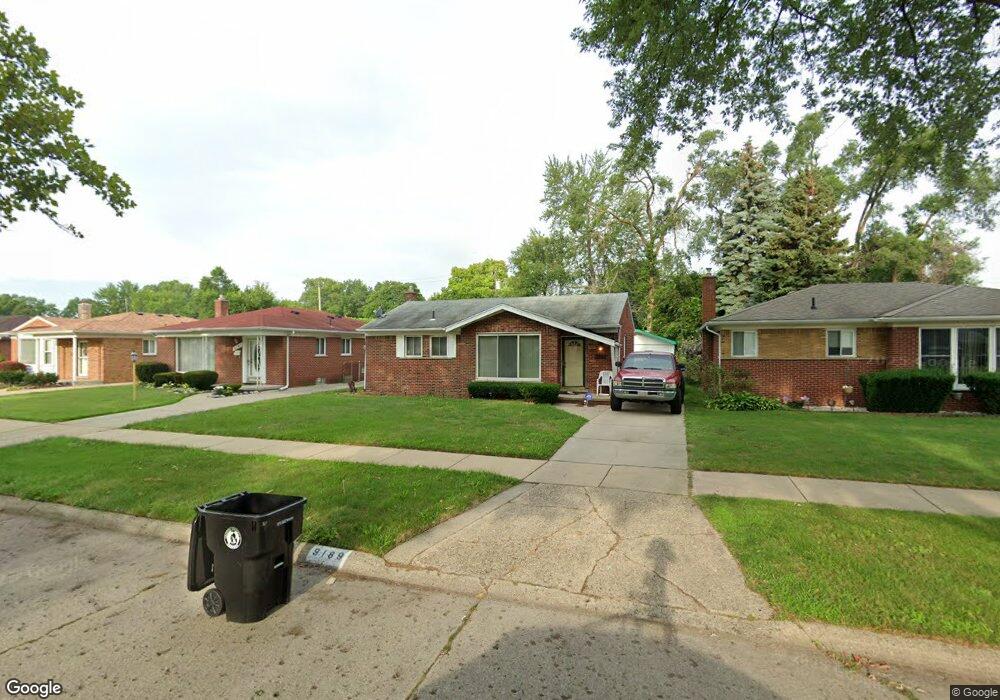
9189 Appleton Redford, MI 48239
Estimated Value: $185,228 - $206,000
--
Bed
1
Bath
1,013
Sq Ft
$193/Sq Ft
Est. Value
About This Home
This home is located at 9189 Appleton, Redford, MI 48239 and is currently estimated at $195,057, approximately $192 per square foot. 9189 Appleton is a home located in Wayne County with nearby schools including John D. Pierce Middle School, Lee M. Thurston High School, and Global Heights Academy.
Ownership History
Date
Name
Owned For
Owner Type
Purchase Details
Closed on
May 16, 2025
Sold by
Morozov Montanik
Bought by
Sous Omar and Sous Mohammad
Current Estimated Value
Purchase Details
Closed on
Oct 15, 2014
Sold by
Morozov Montanik and Henderson Montanik
Bought by
Morozov Montanik
Home Financials for this Owner
Home Financials are based on the most recent Mortgage that was taken out on this home.
Original Mortgage
$104,250
Interest Rate
4.21%
Mortgage Type
New Conventional
Purchase Details
Closed on
Jun 21, 2004
Sold by
Tucker Carol D and Wilson Carol D
Bought by
Henderson Montanik
Create a Home Valuation Report for This Property
The Home Valuation Report is an in-depth analysis detailing your home's value as well as a comparison with similar homes in the area
Home Values in the Area
Average Home Value in this Area
Purchase History
| Date | Buyer | Sale Price | Title Company |
|---|---|---|---|
| Sous Omar | $200,000 | None Listed On Document | |
| Sous Omar | $200,000 | None Listed On Document | |
| Morozov Montanik | -- | Servicelink | |
| Henderson Montanik | $138,900 | Multiple |
Source: Public Records
Mortgage History
| Date | Status | Borrower | Loan Amount |
|---|---|---|---|
| Previous Owner | Morozov Montanik | $104,250 |
Source: Public Records
Tax History Compared to Growth
Tax History
| Year | Tax Paid | Tax Assessment Tax Assessment Total Assessment is a certain percentage of the fair market value that is determined by local assessors to be the total taxable value of land and additions on the property. | Land | Improvement |
|---|---|---|---|---|
| 2025 | $644 | $80,900 | $0 | $0 |
| 2024 | $644 | $72,000 | $0 | $0 |
| 2023 | $616 | $62,200 | $0 | $0 |
| 2022 | $1,845 | $53,100 | $0 | $0 |
| 2021 | $1,959 | $50,900 | $0 | $0 |
| 2020 | $1,768 | $45,900 | $0 | $0 |
| 2019 | $1,731 | $35,100 | $0 | $0 |
| 2018 | $555 | $29,000 | $0 | $0 |
| 2017 | $1,919 | $26,800 | $0 | $0 |
| 2016 | $1,496 | $24,900 | $0 | $0 |
| 2015 | $2,330 | $23,300 | $0 | $0 |
| 2013 | $2,410 | $24,600 | $0 | $0 |
| 2012 | $1,707 | $27,200 | $6,900 | $20,300 |
Source: Public Records
Map
Nearby Homes