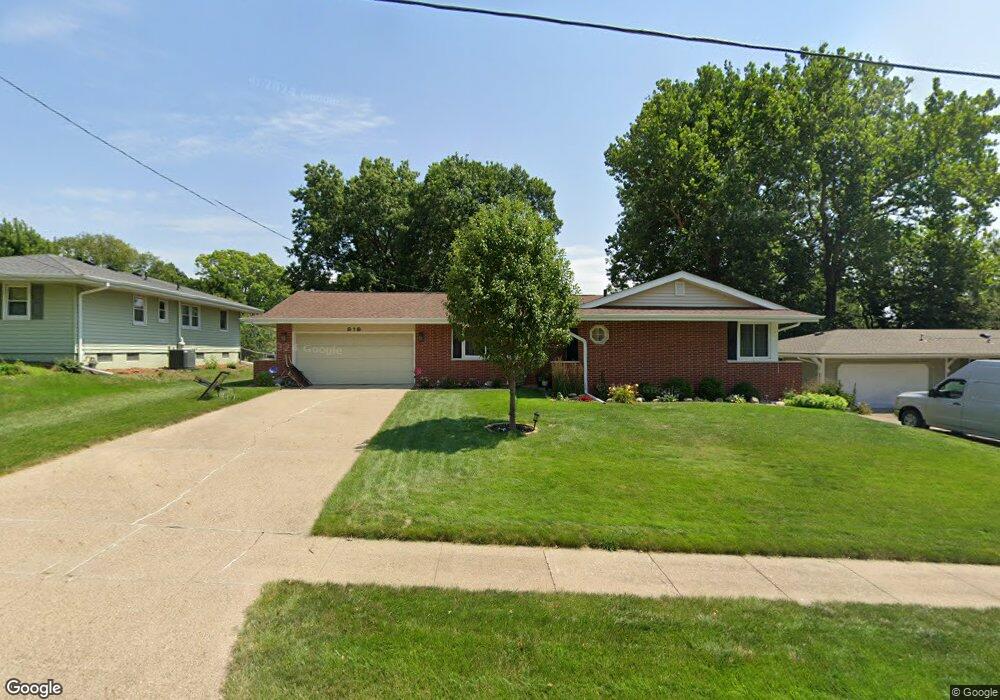
919 30th St West Des Moines, IA 50265
Estimated Value: $301,000 - $327,000
4
Beds
2
Baths
1,247
Sq Ft
$249/Sq Ft
Est. Value
About This Home
This home is located at 919 30th St, West Des Moines, IA 50265 and is currently estimated at $310,535, approximately $249 per square foot. 919 30th St is a home located in Polk County with nearby schools including Fairmeadows Elementary School, Stilwell Junior High School, and Valley Southwoods Freshman High School.
Ownership History
Date
Name
Owned For
Owner Type
Purchase Details
Closed on
Jan 19, 2021
Sold by
Haltom Susan Louise
Bought by
Haltom Susan L and Haltom Terry A
Current Estimated Value
Purchase Details
Closed on
Mar 7, 2019
Sold by
Michelson Helen L and Haltom Susan Louise
Bought by
Haltom Susan Louise
Purchase Details
Closed on
Feb 21, 2008
Sold by
Michelson Helen L
Bought by
Michelson Helen L and Haltom Susan Louise
Create a Home Valuation Report for This Property
The Home Valuation Report is an in-depth analysis detailing your home's value as well as a comparison with similar homes in the area
Home Values in the Area
Average Home Value in this Area
Purchase History
| Date | Buyer | Sale Price | Title Company |
|---|---|---|---|
| Haltom Susan L | -- | None Available | |
| Haltom Susan Louise | -- | None Available | |
| Michelson Helen L | -- | None Available |
Source: Public Records
Tax History Compared to Growth
Tax History
| Year | Tax Paid | Tax Assessment Tax Assessment Total Assessment is a certain percentage of the fair market value that is determined by local assessors to be the total taxable value of land and additions on the property. | Land | Improvement |
|---|---|---|---|---|
| 2025 | $3,952 | $294,000 | $75,200 | $218,800 |
| 2024 | $3,952 | $259,800 | $65,500 | $194,300 |
| 2023 | $3,936 | $259,800 | $65,500 | $194,300 |
| 2022 | $3,888 | $212,700 | $55,500 | $157,200 |
| 2021 | $3,850 | $212,700 | $55,500 | $157,200 |
| 2020 | $3,788 | $200,600 | $52,400 | $148,200 |
| 2019 | $3,500 | $200,600 | $52,400 | $148,200 |
| 2018 | $3,504 | $179,400 | $45,900 | $133,500 |
| 2017 | $3,268 | $179,400 | $45,900 | $133,500 |
| 2016 | $3,192 | $163,100 | $41,300 | $121,800 |
| 2015 | $3,192 | $163,100 | $41,300 | $121,800 |
| 2014 | $3,060 | $155,000 | $38,500 | $116,500 |
Source: Public Records
Map
Nearby Homes