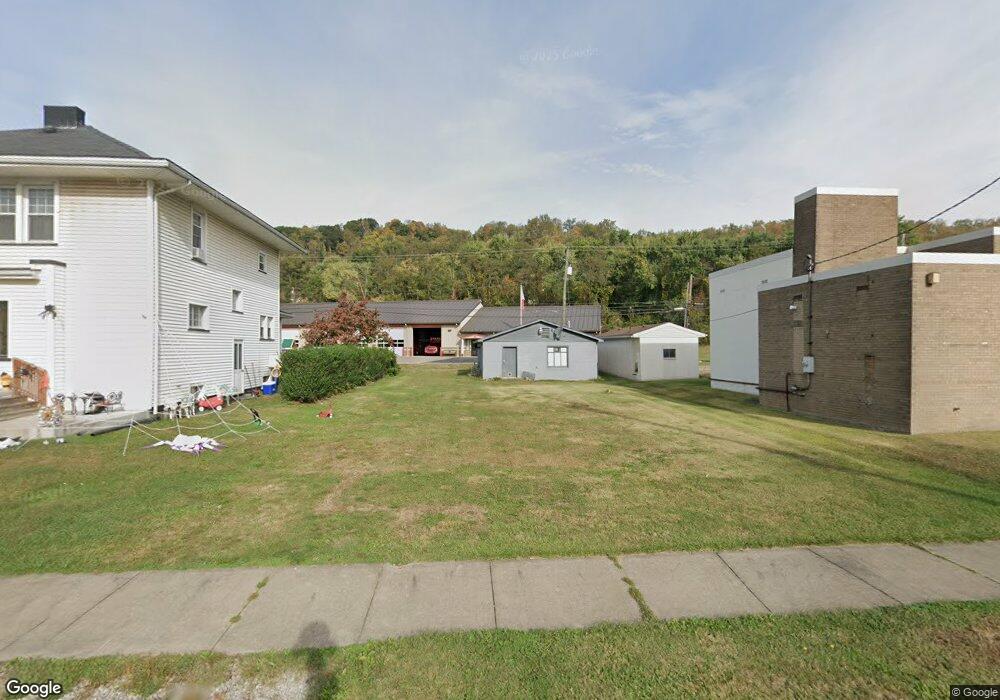
919 3rd St Brilliant, OH 43913
Brilliant NeighborhoodEstimated Value: $66,000 - $95,000
3
Beds
1
Bath
1,179
Sq Ft
$63/Sq Ft
Est. Value
About This Home
This home is located at 919 3rd St, Brilliant, OH 43913 and is currently estimated at $74,639, approximately $63 per square foot. 919 3rd St is a home located in Jefferson County with nearby schools including Buckeye Local High School.
Ownership History
Date
Name
Owned For
Owner Type
Purchase Details
Closed on
Nov 11, 2021
Sold by
Dennis Raymond and Dennis Penny
Bought by
Kyle Reid Investments Llc
Current Estimated Value
Purchase Details
Closed on
Jan 25, 2012
Sold by
Secretary Of Housing And Urban Developme
Bought by
Patterson Craig S and Fellow Vickie L
Purchase Details
Closed on
Sep 26, 2011
Sold by
Us Bank Na
Bought by
Secretary Of Housing And Urban Developme
Purchase Details
Closed on
May 18, 2011
Sold by
Abdalla Fred J
Bought by
Us Bank
Purchase Details
Closed on
Jan 11, 2008
Sold by
Craig Merrill K and Craig Rhonda L
Bought by
Stewart Kaylaa and Muscari Bryan A
Home Financials for this Owner
Home Financials are based on the most recent Mortgage that was taken out on this home.
Original Mortgage
$62,062
Interest Rate
6.17%
Create a Home Valuation Report for This Property
The Home Valuation Report is an in-depth analysis detailing your home's value as well as a comparison with similar homes in the area
Home Values in the Area
Average Home Value in this Area
Purchase History
| Date | Buyer | Sale Price | Title Company |
|---|---|---|---|
| Kyle Reid Investments Llc | $10,000 | None Available | |
| Patterson Craig S | -- | -- | |
| Secretary Of Housing And Urban Developme | -- | -- | |
| Us Bank | -- | -- | |
| Stewart Kaylaa | -- | -- |
Source: Public Records
Mortgage History
| Date | Status | Borrower | Loan Amount |
|---|---|---|---|
| Previous Owner | Stewart Kaylaa | $62,062 |
Source: Public Records
Tax History
| Year | Tax Paid | Tax Assessment Tax Assessment Total Assessment is a certain percentage of the fair market value that is determined by local assessors to be the total taxable value of land and additions on the property. | Land | Improvement |
|---|---|---|---|---|
| 2024 | $184 | $4,904 | $2,643 | $2,261 |
| 2023 | $184 | $3,913 | $2,275 | $1,638 |
| 2022 | $157 | $3,913 | $2,275 | $1,638 |
| 2021 | $157 | $3,913 | $2,275 | $1,638 |
| 2020 | $161 | $3,913 | $2,275 | $1,638 |
| 2019 | $155 | $0 | $0 | $0 |
| 2018 | $138 | $0 | $0 | $0 |
| 2017 | $176 | $0 | $0 | $0 |
| 2016 | $201 | $0 | $0 | $0 |
| 2015 | $181 | $0 | $0 | $0 |
| 2014 | $183 | $0 | $0 | $0 |
| 2012 | $329 | $19,635 | $2,555 | $17,080 |
Source: Public Records
Map
Nearby Homes
Your Personal Tour Guide
Ask me questions while you tour the home.