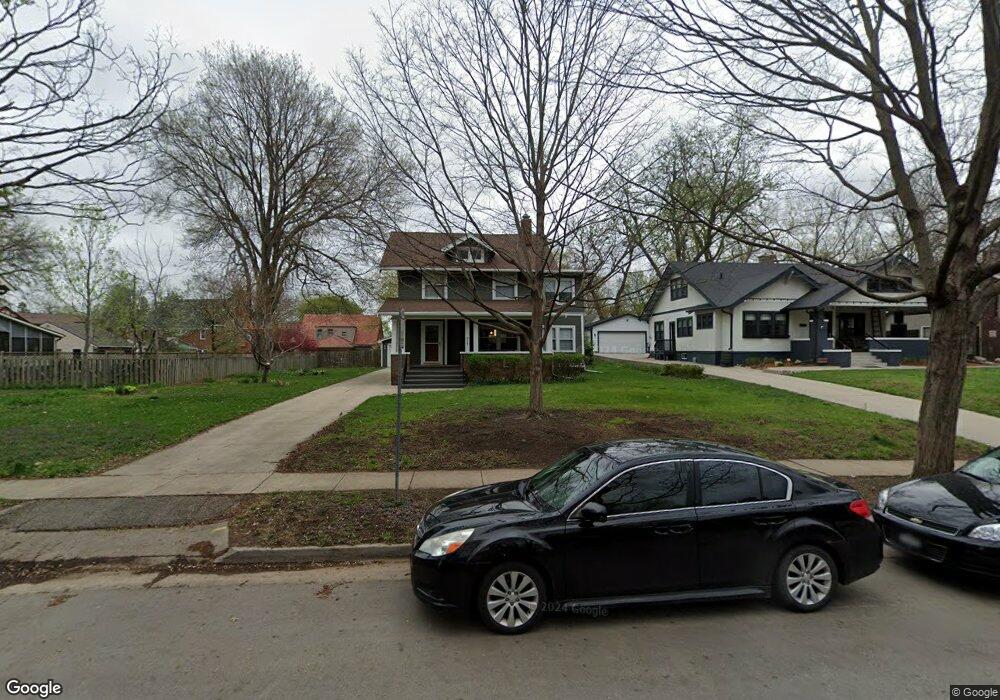
919 45th St Des Moines, IA 50312
Waveland Park NeighborhoodEstimated Value: $424,000 - $435,000
4
Beds
3
Baths
2,281
Sq Ft
$187/Sq Ft
Est. Value
About This Home
This home is located at 919 45th St, Des Moines, IA 50312 and is currently estimated at $427,417, approximately $187 per square foot. 919 45th St is a home located in Polk County with nearby schools including Hubbell Elementary, Merrill Middle School, and Roosevelt High School.
Ownership History
Date
Name
Owned For
Owner Type
Purchase Details
Closed on
Aug 23, 2023
Sold by
Hupton Linda J
Bought by
Stamper Adrian W and Stamper Anne
Current Estimated Value
Purchase Details
Closed on
Jun 5, 2017
Sold by
Hupton Clyde Edward
Bought by
Hupton Linda J
Create a Home Valuation Report for This Property
The Home Valuation Report is an in-depth analysis detailing your home's value as well as a comparison with similar homes in the area
Home Values in the Area
Average Home Value in this Area
Purchase History
| Date | Buyer | Sale Price | Title Company |
|---|---|---|---|
| Stamper Adrian W | $300,000 | None Listed On Document | |
| Hupton Linda J | -- | None Available |
Source: Public Records
Tax History Compared to Growth
Tax History
| Year | Tax Paid | Tax Assessment Tax Assessment Total Assessment is a certain percentage of the fair market value that is determined by local assessors to be the total taxable value of land and additions on the property. | Land | Improvement |
|---|---|---|---|---|
| 2025 | $5,874 | $382,200 | $70,100 | $312,100 |
| 2024 | $5,874 | $350,500 | $64,000 | $286,500 |
| 2023 | $5,874 | $313,200 | $69,900 | $243,300 |
| 2022 | $5,874 | $258,100 | $60,800 | $197,300 |
| 2021 | $5,828 | $258,100 | $60,800 | $197,300 |
| 2020 | $5,862 | $234,900 | $55,600 | $179,300 |
| 2019 | $5,192 | $234,900 | $55,600 | $179,300 |
| 2018 | $4,824 | $201,700 | $50,200 | $151,500 |
| 2017 | $4,196 | $201,700 | $50,200 | $151,500 |
| 2016 | $4,080 | $178,500 | $44,200 | $134,300 |
| 2015 | $4,080 | $178,500 | $44,200 | $134,300 |
| 2014 | $3,610 | $164,900 | $40,900 | $124,000 |
Source: Public Records
Map
Nearby Homes
- 4303 Crocker St
- 1021 45th St
- 1055 46th St
- 4200 Kingman Blvd
- 812 Polk Blvd
- 1001 42nd St
- 1008 Kingman Cir
- 702 45th Place
- 702 Polk Blvd
- 689 42nd St
- 4036 Plainview Dr
- 870 39th St
- 725 40th St
- 4012 Pleasant St
- 4902 University Ave Unit 335
- 642 Polk Blvd
- 633 48th St
- 4000 University Ave Unit 7
- 3908 Pleasant St
- 1005 38th St