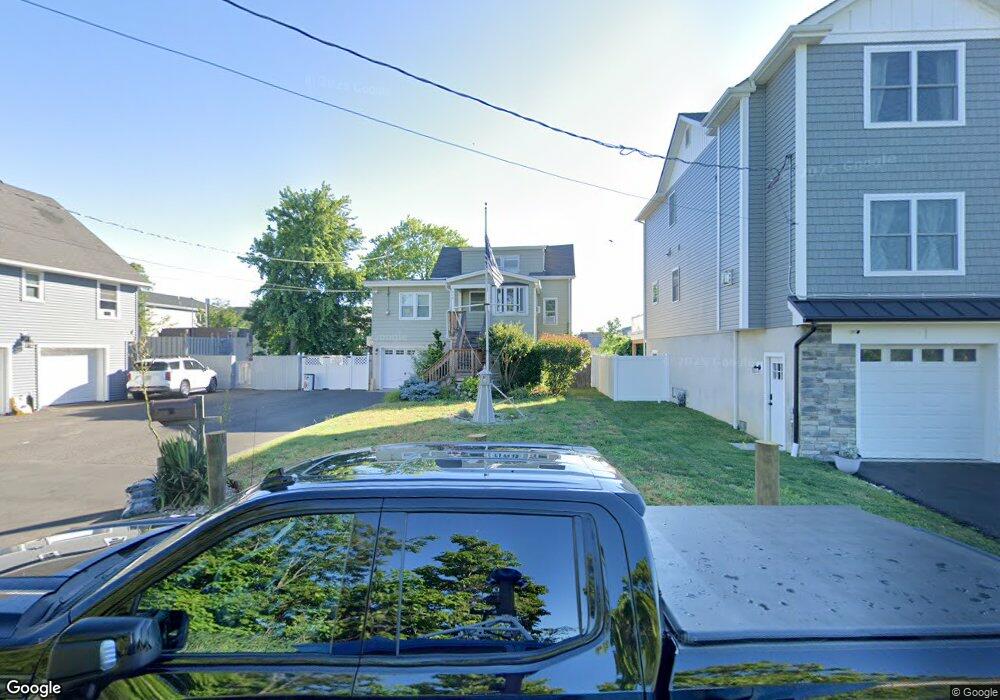
919 4th St Union Beach, NJ 07735
Estimated Value: $449,363 - $472,000
4
Beds
1
Bath
1,262
Sq Ft
$364/Sq Ft
Est. Value
About This Home
This home is located at 919 4th St, Union Beach, NJ 07735 and is currently estimated at $459,341, approximately $363 per square foot. 919 4th St is a home located in Monmouth County with nearby schools including Memorial School and Baytul-Iman Academy.
Ownership History
Date
Name
Owned For
Owner Type
Purchase Details
Closed on
Jan 14, 2022
Sold by
Forte Nicole S and Forte Anthony L
Bought by
Forte Anthony L
Current Estimated Value
Purchase Details
Closed on
Jan 13, 2012
Sold by
Forte Anthony L and Forte Nicole S
Bought by
Forte Anthony L and Forte Nicole S
Home Financials for this Owner
Home Financials are based on the most recent Mortgage that was taken out on this home.
Original Mortgage
$238,271
Interest Rate
4.25%
Mortgage Type
FHA
Purchase Details
Closed on
Nov 29, 2005
Sold by
Rose Jackson Estate
Bought by
Forte Anthony L and Liberti Nicole S
Home Financials for this Owner
Home Financials are based on the most recent Mortgage that was taken out on this home.
Original Mortgage
$254,985
Interest Rate
6.17%
Mortgage Type
FHA
Create a Home Valuation Report for This Property
The Home Valuation Report is an in-depth analysis detailing your home's value as well as a comparison with similar homes in the area
Home Values in the Area
Average Home Value in this Area
Purchase History
We collect this data history from publicly available records. To have your information removed, we recommend requesting removal directly through your county’s website.
| Date | Buyer | Sale Price | Title Company |
|---|---|---|---|
| Forte Anthony L | -- | None Listed On Document | |
| Forte Anthony L | -- | None Listed On Document | |
| Forte Anthony L | -- | Transtar National Title | |
| Forte Anthony L | $257,000 | -- |
Source: Public Records
Mortgage History
We collect this data history from publicly available records. To have your information removed, we recommend requesting removal directly through your county’s website.
| Date | Status | Borrower | Loan Amount |
|---|---|---|---|
| Previous Owner | Forte Anthony L | $238,271 | |
| Previous Owner | Forte Anthony L | $254,985 |
Source: Public Records
Tax History
| Year | Tax Paid | Tax Assessment Tax Assessment Total Assessment is a certain percentage of the fair market value that is determined by local assessors to be the total taxable value of land and additions on the property. | Land | Improvement |
|---|---|---|---|---|
| 2025 | $7,844 | $418,400 | $214,400 | $204,000 |
| 2024 | $7,499 | $380,400 | $186,400 | $194,000 |
| 2023 | $7,499 | $350,400 | $162,100 | $188,300 |
| 2022 | $6,361 | $291,000 | $120,100 | $170,900 |
| 2021 | $6,361 | $259,100 | $106,300 | $152,800 |
| 2020 | $6,016 | $239,100 | $96,300 | $142,800 |
| 2019 | $5,769 | $223,700 | $87,500 | $136,200 |
| 2018 | $5,691 | $212,100 | $80,000 | $132,100 |
| 2017 | $4,943 | $177,100 | $67,500 | $109,600 |
| 2016 | $4,563 | $163,600 | $70,000 | $93,600 |
| 2015 | $4,500 | $164,300 | $75,000 | $89,300 |
| 2014 | $4,721 | $142,100 | $77,800 | $64,300 |
Source: Public Records
Map
Nearby Homes
Your Personal Tour Guide
Ask me questions while you tour the home.