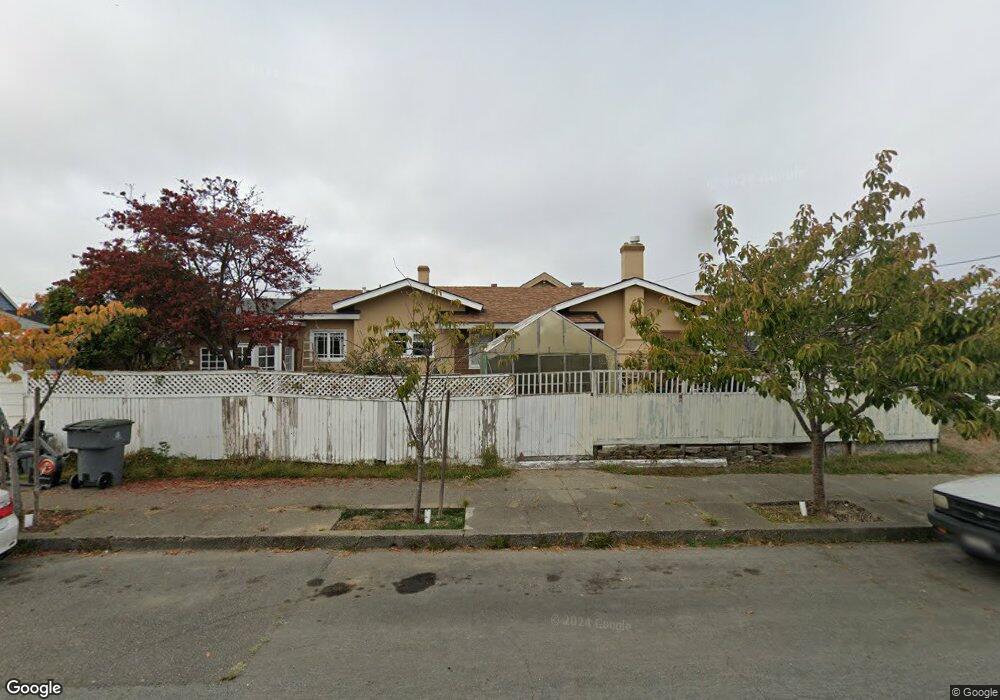
919 9th St Eureka, CA 95501
City Center NeighborhoodEstimated Value: $311,000 - $579,000
3
Beds
2
Baths
1,616
Sq Ft
$251/Sq Ft
Est. Value
About This Home
This home is located at 919 9th St, Eureka, CA 95501 and is currently estimated at $406,348, approximately $251 per square foot. 919 9th St is a home located in Humboldt County with nearby schools including Washington Elementary School, Catherine L. Zane Middle School, and Eureka Senior High School.
Ownership History
Date
Name
Owned For
Owner Type
Purchase Details
Closed on
Feb 24, 2010
Sold by
Allen Calva M and Thrash Stanley A
Bought by
Allen Calva M
Current Estimated Value
Purchase Details
Closed on
Jul 10, 2002
Sold by
Williamson Cora J
Bought by
Williamson Cora J and Cora J Williamson Revocable Li
Purchase Details
Closed on
Feb 9, 1998
Sold by
Williamson Cora J and Williamson Dolly
Bought by
Calva Williamson Dolly and Calva Allen
Create a Home Valuation Report for This Property
The Home Valuation Report is an in-depth analysis detailing your home's value as well as a comparison with similar homes in the area
Home Values in the Area
Average Home Value in this Area
Purchase History
| Date | Buyer | Sale Price | Title Company |
|---|---|---|---|
| Allen Calva M | -- | None Available | |
| Williamson Cora J | -- | Fidelity National Title Co | |
| Williamson Cora J | -- | Fidelity National Title Co | |
| Calva Williamson Dolly | -- | -- |
Source: Public Records
Tax History
| Year | Tax Paid | Tax Assessment Tax Assessment Total Assessment is a certain percentage of the fair market value that is determined by local assessors to be the total taxable value of land and additions on the property. | Land | Improvement |
|---|---|---|---|---|
| 2025 | $1,330 | $129,340 | $41,861 | $87,479 |
| 2024 | $1,330 | $126,805 | $41,041 | $85,764 |
| 2023 | $1,312 | $124,320 | $40,237 | $84,083 |
| 2022 | $1,361 | $121,884 | $39,449 | $82,435 |
| 2021 | $1,334 | $119,495 | $38,676 | $80,819 |
| 2020 | $1,266 | $118,271 | $38,280 | $79,991 |
| 2019 | $1,240 | $115,953 | $37,530 | $78,423 |
| 2018 | $1,221 | $113,681 | $36,795 | $76,886 |
| 2017 | $1,215 | $111,453 | $36,074 | $75,379 |
| 2016 | $1,215 | $109,268 | $35,367 | $73,901 |
| 2015 | $1,204 | $107,627 | $34,836 | $72,791 |
| 2014 | $1,126 | $105,520 | $34,154 | $71,366 |
Source: Public Records
Map
Nearby Homes
Your Personal Tour Guide
Ask me questions while you tour the home.