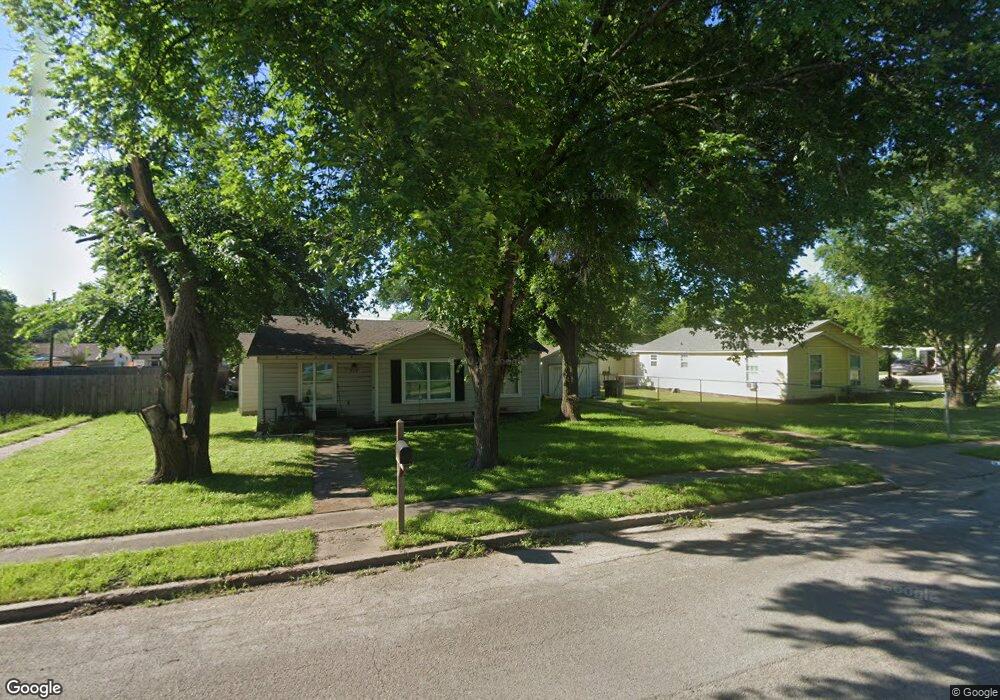
919 Bales St Cleburne, TX 76033
Estimated Value: $195,000 - $212,250
3
Beds
1
Bath
1,144
Sq Ft
$178/Sq Ft
Est. Value
About This Home
This home is located at 919 Bales St, Cleburne, TX 76033 and is currently estimated at $203,063, approximately $177 per square foot. 919 Bales St is a home located in Johnson County with nearby schools including Cooke Elementary School, A.D. Wheat Middle School, and Cleburne High School.
Ownership History
Date
Name
Owned For
Owner Type
Purchase Details
Closed on
Nov 26, 2018
Sold by
Pathway Site Construction Llc
Bought by
Anderson Damon
Current Estimated Value
Home Financials for this Owner
Home Financials are based on the most recent Mortgage that was taken out on this home.
Original Mortgage
$59,999
Outstanding Balance
$52,966
Interest Rate
4.9%
Mortgage Type
Purchase Money Mortgage
Estimated Equity
$150,097
Purchase Details
Closed on
Jun 15, 2018
Sold by
Sullivan Rodney
Bought by
Sullivan Leonard R
Purchase Details
Closed on
Feb 4, 2014
Sold by
Ballas Edward and Ballas Yvonne
Bought by
Sullivan Rodney
Purchase Details
Closed on
Sep 13, 2010
Sold by
Wells Fargo Bank Na
Bought by
The Secretary Of Housing & Urban Develop
Create a Home Valuation Report for This Property
The Home Valuation Report is an in-depth analysis detailing your home's value as well as a comparison with similar homes in the area
Home Values in the Area
Average Home Value in this Area
Purchase History
| Date | Buyer | Sale Price | Title Company |
|---|---|---|---|
| Anderson Damon | -- | Capital Title | |
| Sullivan Leonard R | -- | None Available | |
| Sullivan Rodney | -- | Providence Title | |
| The Secretary Of Housing & Urban Develop | -- | None Available |
Source: Public Records
Mortgage History
| Date | Status | Borrower | Loan Amount |
|---|---|---|---|
| Open | Anderson Damon | $59,999 |
Source: Public Records
Tax History
| Year | Tax Paid | Tax Assessment Tax Assessment Total Assessment is a certain percentage of the fair market value that is determined by local assessors to be the total taxable value of land and additions on the property. | Land | Improvement |
|---|---|---|---|---|
| 2025 | $5,141 | $230,568 | $40,000 | $190,568 |
| 2024 | $5,141 | $230,568 | $40,000 | $190,568 |
| 2023 | $5,061 | $227,441 | $40,000 | $187,441 |
| 2022 | $3,285 | $131,244 | $35,250 | $95,994 |
| 2021 | $2,737 | $104,887 | $30,500 | $74,387 |
| 2020 | $2,939 | $106,075 | $22,000 | $84,075 |
| 2019 | $3,134 | $106,075 | $22,000 | $84,075 |
| 2018 | $1,911 | $64,661 | $19,250 | $45,411 |
| 2017 | $1,519 | $62,498 | $19,250 | $43,248 |
| 2016 | $1,381 | $46,900 | $14,000 | $32,900 |
| 2015 | $1,283 | $46,900 | $14,000 | $32,900 |
| 2014 | $1,283 | $48,136 | $14,000 | $34,136 |
Source: Public Records
Map
Nearby Homes
- 916 Poindexter Ave
- 603 Madison St
- 718 Turner St
- 807 Poindexter Ave
- 1102 Poindexter Ave
- 902 Turner St
- 1105 Poindexter Ave
- 504 Bales St
- 700 Poindexter Ave
- 809 Euclid St
- 1123 Bales St
- 1307 Joslin St
- 905 Euclid St
- 604 Poindexter Ave
- 805 Phillips St
- 1111 N Douglas Ave Unit Lot 2
- 502 Madison St
- 603 Lilly St
- 1202 Holly St
- 910 Baird St
Your Personal Tour Guide
Ask me questions while you tour the home.