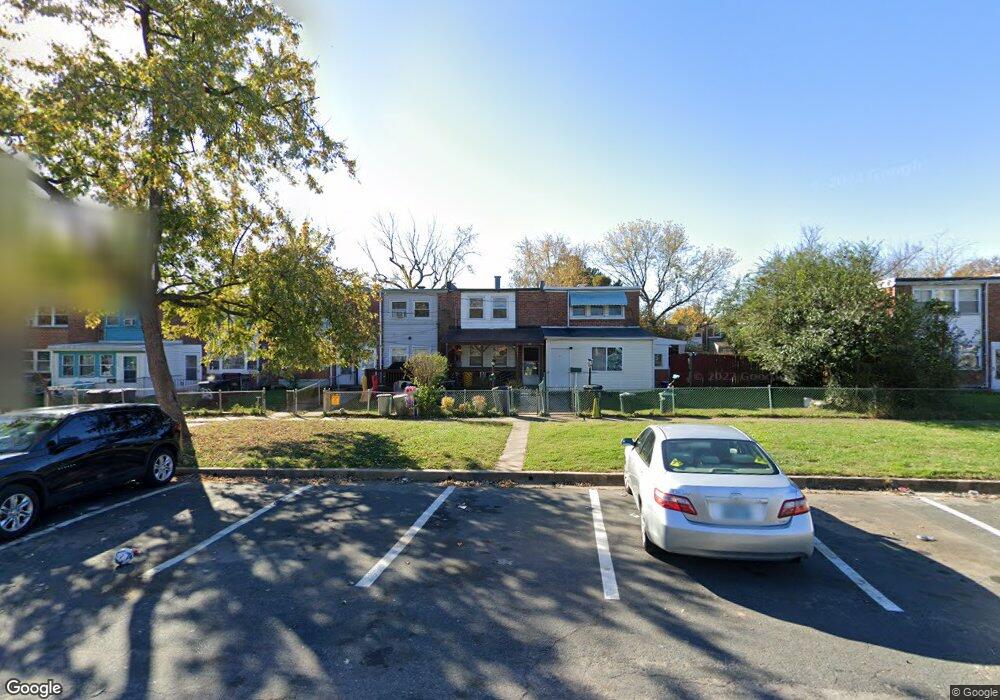
919 Catawba Ct Halethorpe, MD 21227
Lansdowne NeighborhoodEstimated Value: $158,000 - $166,000
--
Bed
1
Bath
1,024
Sq Ft
$158/Sq Ft
Est. Value
About This Home
This home is located at 919 Catawba Ct, Halethorpe, MD 21227 and is currently estimated at $161,401, approximately $157 per square foot. 919 Catawba Ct is a home located in Baltimore County with nearby schools including Riverview Elementary School, Lansdowne Middle School, and Lansdowne High School.
Ownership History
Date
Name
Owned For
Owner Type
Purchase Details
Closed on
Jan 24, 2007
Sold by
Saffran May L
Bought by
Lavalle Juan and Ocampo Maria Jimena Garrido
Current Estimated Value
Home Financials for this Owner
Home Financials are based on the most recent Mortgage that was taken out on this home.
Original Mortgage
$116,400
Outstanding Balance
$74,835
Interest Rate
7.52%
Mortgage Type
Purchase Money Mortgage
Estimated Equity
$86,566
Purchase Details
Closed on
Jan 12, 2007
Sold by
Saffran May L
Bought by
Lavalle Juan and Ocampo Maria Jimena Garrido
Home Financials for this Owner
Home Financials are based on the most recent Mortgage that was taken out on this home.
Original Mortgage
$116,400
Outstanding Balance
$74,835
Interest Rate
7.52%
Mortgage Type
Purchase Money Mortgage
Estimated Equity
$86,566
Purchase Details
Closed on
Jun 6, 2001
Sold by
Saffran May L
Bought by
Saffran May L
Purchase Details
Closed on
May 27, 1999
Sold by
Gatton Kay F
Bought by
Saffran May L and Belt Sharon M
Create a Home Valuation Report for This Property
The Home Valuation Report is an in-depth analysis detailing your home's value as well as a comparison with similar homes in the area
Home Values in the Area
Average Home Value in this Area
Purchase History
| Date | Buyer | Sale Price | Title Company |
|---|---|---|---|
| Lavalle Juan | $120,000 | -- | |
| Lavalle Juan | $120,000 | -- | |
| Saffran May L | -- | -- | |
| Saffran May L | $55,000 | -- |
Source: Public Records
Mortgage History
| Date | Status | Borrower | Loan Amount |
|---|---|---|---|
| Open | Lavalle Juan | $116,400 | |
| Closed | Lavalle Juan | $116,400 |
Source: Public Records
Tax History Compared to Growth
Tax History
| Year | Tax Paid | Tax Assessment Tax Assessment Total Assessment is a certain percentage of the fair market value that is determined by local assessors to be the total taxable value of land and additions on the property. | Land | Improvement |
|---|---|---|---|---|
| 2025 | $1,881 | $109,500 | -- | -- |
| 2024 | $1,881 | $99,400 | $36,000 | $63,400 |
| 2023 | $904 | $95,967 | $0 | $0 |
| 2022 | $1,815 | $92,533 | $0 | $0 |
| 2021 | $1,725 | $89,100 | $36,000 | $53,100 |
| 2020 | $1,725 | $88,233 | $0 | $0 |
| 2019 | $1,735 | $87,367 | $0 | $0 |
| 2018 | $1,737 | $86,500 | $36,000 | $50,500 |
| 2017 | $1,602 | $84,433 | $0 | $0 |
| 2016 | $1,584 | $82,367 | $0 | $0 |
| 2015 | $1,584 | $80,300 | $0 | $0 |
| 2014 | $1,584 | $80,300 | $0 | $0 |
Source: Public Records
Map
Nearby Homes
- 3055 Freeway
- 4157 Hollins Ferry Rd
- 4007 Hollins Ferry Rd
- 430 Burbank Ct
- 3103 Ryerson Cir
- 3311 Kessler Ct
- 4435 Scotia Rd
- 4101 Oak Rd
- 3507 Clover Ave
- 4415 Norfen Rd
- 4322 Annapolis Rd
- 2725 Yarnall Rd
- 4344 Annapolis Rd
- 130 5th Ave
- 4432 Annapolis Rd
- 2807 Illinois Ave
- 2423 Alma Rd
- 108 4th Ave
- 121 3rd Ave
- 2828 Alabama Ave