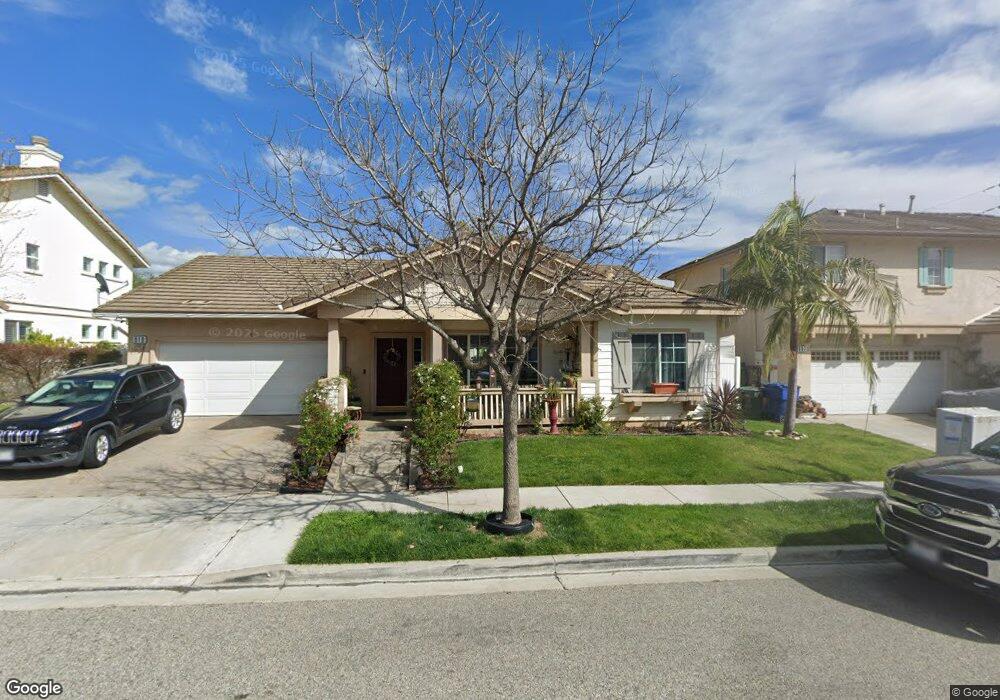
919 Hinckley Ln Fillmore, CA 93015
Estimated Value: $691,312 - $755,000
3
Beds
2
Baths
1,492
Sq Ft
$478/Sq Ft
Est. Value
About This Home
This home is located at 919 Hinckley Ln, Fillmore, CA 93015 and is currently estimated at $713,078, approximately $477 per square foot. 919 Hinckley Ln is a home located in Ventura County with nearby schools including Fillmore Senior High.
Ownership History
Date
Name
Owned For
Owner Type
Purchase Details
Closed on
Aug 3, 2021
Sold by
Mendez Edmundo and Mendez Maria Cristina
Bought by
Mendez Edmundo and Mendez Maria Cristina
Current Estimated Value
Home Financials for this Owner
Home Financials are based on the most recent Mortgage that was taken out on this home.
Original Mortgage
$331,200
Outstanding Balance
$301,163
Interest Rate
2.9%
Mortgage Type
New Conventional
Estimated Equity
$411,915
Purchase Details
Closed on
Feb 14, 2002
Sold by
Griffin Homebuilding Group Llc
Bought by
Mendez Edmundo and Mendez Maria Cristina
Home Financials for this Owner
Home Financials are based on the most recent Mortgage that was taken out on this home.
Original Mortgage
$204,750
Interest Rate
6.8%
Mortgage Type
Stand Alone First
Create a Home Valuation Report for This Property
The Home Valuation Report is an in-depth analysis detailing your home's value as well as a comparison with similar homes in the area
Home Values in the Area
Average Home Value in this Area
Purchase History
| Date | Buyer | Sale Price | Title Company |
|---|---|---|---|
| Mendez Edmundo | -- | Avenue 365 Lender Svcs Llc | |
| Mendez Edmundo | $256,000 | First American Title Ins Co |
Source: Public Records
Mortgage History
| Date | Status | Borrower | Loan Amount |
|---|---|---|---|
| Open | Mendez Edmundo | $331,200 | |
| Closed | Mendez Edmundo | $204,750 |
Source: Public Records
Tax History Compared to Growth
Tax History
| Year | Tax Paid | Tax Assessment Tax Assessment Total Assessment is a certain percentage of the fair market value that is determined by local assessors to be the total taxable value of land and additions on the property. | Land | Improvement |
|---|---|---|---|---|
| 2025 | $5,276 | $378,144 | $151,255 | $226,889 |
| 2024 | $5,276 | $370,730 | $148,289 | $222,441 |
| 2023 | $5,215 | $363,461 | $145,381 | $218,080 |
| 2022 | $4,871 | $356,335 | $142,531 | $213,804 |
| 2021 | $5,331 | $349,349 | $139,737 | $209,612 |
| 2020 | $5,020 | $345,768 | $138,305 | $207,463 |
| 2019 | $4,996 | $338,990 | $135,594 | $203,396 |
| 2018 | $4,891 | $332,344 | $132,936 | $199,408 |
| 2017 | $4,884 | $325,829 | $130,330 | $195,499 |
| 2016 | $4,568 | $319,441 | $127,775 | $191,666 |
| 2015 | $4,455 | $314,644 | $125,856 | $188,788 |
| 2014 | $4,429 | $308,483 | $123,392 | $185,091 |
Source: Public Records
Map
Nearby Homes
- 931 Hinckley Ln
- 907 Hinckley Ln
- 943 Hinckley Ln
- 922 Hinckley Ln
- 908 Hinckley Ln
- 936 Hinckley Ln
- 900 Hinckley Ln
- 899 Hinckley Ln
- 951 Hinckley Ln
- 925 Taylor Ln
- 969 5th St
- 948 Hinckley Ln
- 927 Taylor Ln
- 898 Hinckley Ln
- 958 Hinckley Ln
- 965 Hinckley Ln
- 957 5th St
- 895 Hinckley Ln
- 923 Taylor Ln
- 959 Taylor Ln