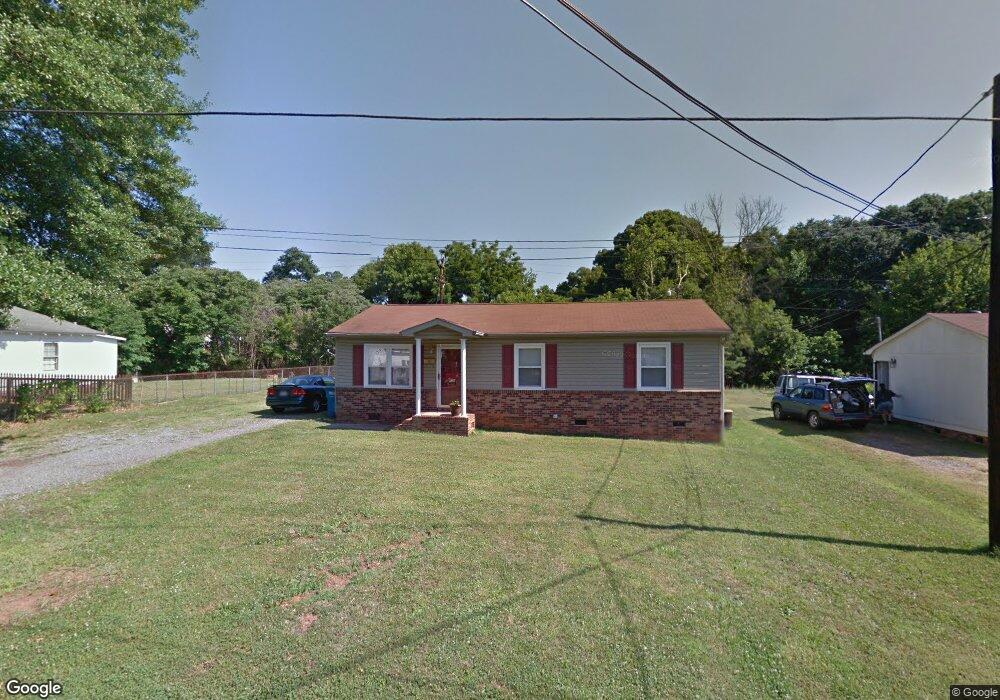
919 Laye St Belmont, NC 28012
Estimated Value: $248,000 - $284,292
3
Beds
1
Bath
1,008
Sq Ft
$259/Sq Ft
Est. Value
About This Home
This home is located at 919 Laye St, Belmont, NC 28012 and is currently estimated at $261,323, approximately $259 per square foot. 919 Laye St is a home located in Gaston County with nearby schools including J B Page Elementary School, Belmont Central Elementary School, and Belmont Middle School.
Ownership History
Date
Name
Owned For
Owner Type
Purchase Details
Closed on
Jun 29, 2018
Sold by
Sweet Southern Homes Llc
Bought by
Weeter Holly
Current Estimated Value
Home Financials for this Owner
Home Financials are based on the most recent Mortgage that was taken out on this home.
Original Mortgage
$127,000
Outstanding Balance
$110,953
Interest Rate
4.87%
Mortgage Type
Adjustable Rate Mortgage/ARM
Estimated Equity
$150,371
Purchase Details
Closed on
Aug 22, 2008
Sold by
The Bank Of New York
Bought by
Joshua Properties Llc
Purchase Details
Closed on
Jun 12, 2008
Sold by
Gibson Earnest V
Bought by
Bank Of New York and The Certificateholders Cwabs Inc Asset B
Purchase Details
Closed on
Jun 6, 2008
Sold by
Joshua Properties Llc
Bought by
Sweet Southern Homes Llc
Create a Home Valuation Report for This Property
The Home Valuation Report is an in-depth analysis detailing your home's value as well as a comparison with similar homes in the area
Home Values in the Area
Average Home Value in this Area
Purchase History
| Date | Buyer | Sale Price | Title Company |
|---|---|---|---|
| Weeter Holly | $125,000 | None Available | |
| Joshua Properties Llc | $63,000 | None Available | |
| Bank Of New York | $63,750 | None Available | |
| Sweet Southern Homes Llc | -- | None Available |
Source: Public Records
Mortgage History
| Date | Status | Borrower | Loan Amount |
|---|---|---|---|
| Open | Weeter Holly | $127,000 |
Source: Public Records
Tax History Compared to Growth
Tax History
| Year | Tax Paid | Tax Assessment Tax Assessment Total Assessment is a certain percentage of the fair market value that is determined by local assessors to be the total taxable value of land and additions on the property. | Land | Improvement |
|---|---|---|---|---|
| 2025 | $2,360 | $223,920 | $55,000 | $168,920 |
| 2024 | $2,360 | $223,920 | $55,000 | $168,920 |
| 2023 | $2,385 | $223,920 | $55,000 | $168,920 |
| 2022 | $1,592 | $122,020 | $22,500 | $99,520 |
| 2021 | $1,641 | $122,020 | $22,500 | $99,520 |
| 2019 | $1,653 | $122,020 | $22,500 | $99,520 |
| 2018 | $1,057 | $76,311 | $12,800 | $63,511 |
| 2017 | $1,026 | $76,311 | $12,800 | $63,511 |
| 2016 | $1,026 | $76,311 | $0 | $0 |
| 2014 | $1,108 | $82,376 | $16,500 | $65,876 |
Source: Public Records
Map
Nearby Homes
- 1 Linestowe Dr
- 70 Volk St
- 901 Edgemont Ave
- 405 Linestowe Dr
- 204 13th St
- 206 13th St
- 201 Sloan St
- 318 6th St
- 5949 Gilchrist Cir
- 5141 Bright Rd
- 302 Planetree Dr
- 1213 Sandra Ct
- 4830 Samuel Pinckney Dr
- 5 S 1st St
- 203 Ewing Dr
- 104 Mckee Cir
- 3131 Channel View Landing
- 4813 Samuel Pinckney Dr
- 201 Browntown Rd
- 6030 Thorburn Way