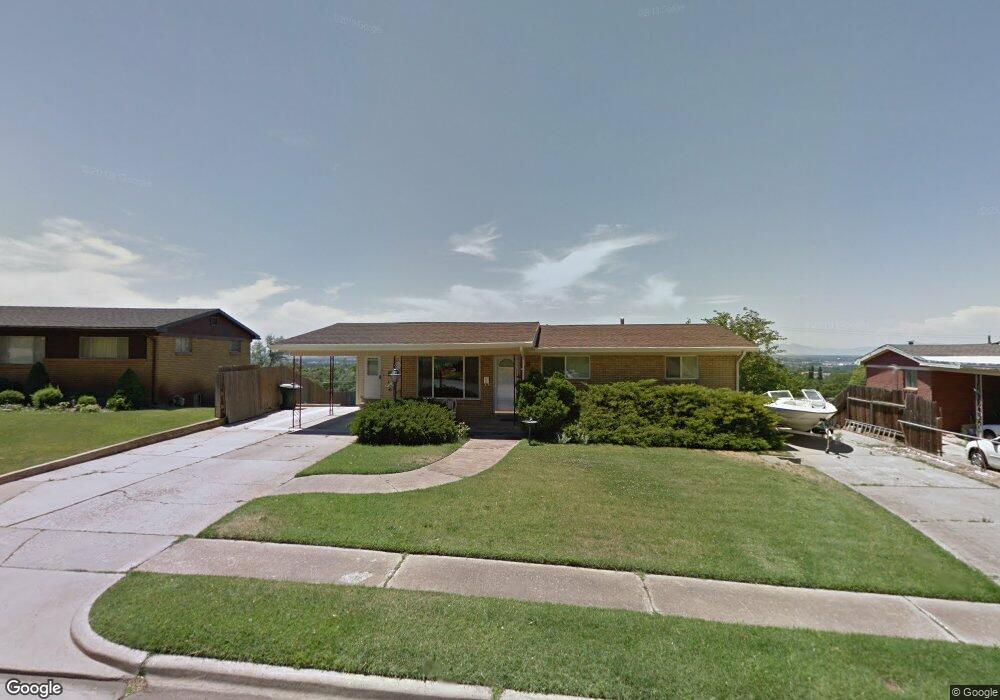
919 Maxfield Dr Ogden, UT 84404
Horace Mann NeighborhoodEstimated Value: $405,000 - $448,412
4
Beds
2
Baths
2,344
Sq Ft
$181/Sq Ft
Est. Value
About This Home
This home is located at 919 Maxfield Dr, Ogden, UT 84404 and is currently estimated at $424,103, approximately $180 per square foot. 919 Maxfield Dr is a home located in Weber County with nearby schools including Mound Fort Junior High School and Ben Lomond High School.
Ownership History
Date
Name
Owned For
Owner Type
Purchase Details
Closed on
Jul 29, 2019
Sold by
Leatham William D
Bought by
Salgado Francisco M
Current Estimated Value
Home Financials for this Owner
Home Financials are based on the most recent Mortgage that was taken out on this home.
Original Mortgage
$241,544
Outstanding Balance
$211,765
Interest Rate
3.75%
Mortgage Type
FHA
Estimated Equity
$212,338
Create a Home Valuation Report for This Property
The Home Valuation Report is an in-depth analysis detailing your home's value as well as a comparison with similar homes in the area
Home Values in the Area
Average Home Value in this Area
Purchase History
We collect this data history from publicly available records. To have your information removed, we recommend requesting removal directly through your county’s website.
| Date | Buyer | Sale Price | Title Company |
|---|---|---|---|
| Salgado Francisco M | -- | Inwest Title South Ogden |
Source: Public Records
Mortgage History
We collect this data history from publicly available records. To have your information removed, we recommend requesting removal directly through your county’s website.
| Date | Status | Borrower | Loan Amount |
|---|---|---|---|
| Open | Salgado Francisco M | $241,544 |
Source: Public Records
Tax History
| Year | Tax Paid | Tax Assessment Tax Assessment Total Assessment is a certain percentage of the fair market value that is determined by local assessors to be the total taxable value of land and additions on the property. | Land | Improvement |
|---|---|---|---|---|
| 2025 | $2,966 | $218,632 | $72,013 | $146,619 |
| 2024 | $2,844 | $207,899 | $72,016 | $135,883 |
| 2023 | $2,960 | $220,000 | $70,603 | $149,397 |
| 2022 | $3,115 | $234,300 | $56,905 | $177,395 |
| 2021 | $2,388 | $293,000 | $68,287 | $224,713 |
| 2020 | $2,265 | $256,000 | $52,626 | $203,374 |
| 2019 | $2,166 | $229,000 | $47,628 | $181,372 |
| 2018 | $1,870 | $194,000 | $47,628 | $146,372 |
| 2017 | $1,623 | $155,000 | $41,959 | $113,041 |
| 2016 | $1,516 | $77,908 | $19,843 | $58,065 |
| 2015 | $1,373 | $68,958 | $19,843 | $49,115 |
| 2014 | $1,366 | $67,657 | $17,091 | $50,566 |
Source: Public Records
Map
Nearby Homes
- 930 Taylor Ave
- 1565 E 775 S Unit 7
- 1565 E 775 S Unit 16
- 793 Simoron Dr
- 718 Robins Ave
- 1484 E 1250 S
- 837 Polk Ave
- 1358 Cross St
- 1348 Cross St
- 572 S Elena Ln
- 571 Elena Ln
- 1342 Cross St
- 1545 E 1300 S
- 1014 Peach Dr
- 1568 Hudson St Unit 1
- 1544 E 1350 S
- 1579 Maddies Cove
- 1473 Hudson St
- 970 Tyler Ave
- 1578 Maddies Cove Unit 18
- 931 Maxfield Dr
- 905 Maxfield Dr
- 920 Fillmore Ave
- 910 Fillmore Ave
- 941 Maxfield Dr
- 926 Maxfield Dr
- 950 Fillmore Ave
- 910 Maxfield Dr
- 960 Stowe Dr
- 940 Maxfield Dr
- 970 Stowe Dr
- 951 Maxfield Dr
- 1632 9th St
- 950 Maxfield Dr
- 980 Stowe Dr
- 1620 9th St
- 925 Fillmore Ave
- 1606 9th St
- 945 Fillmore Ave
- 905 Fillmore Ave
Your Personal Tour Guide
Ask me questions while you tour the home.