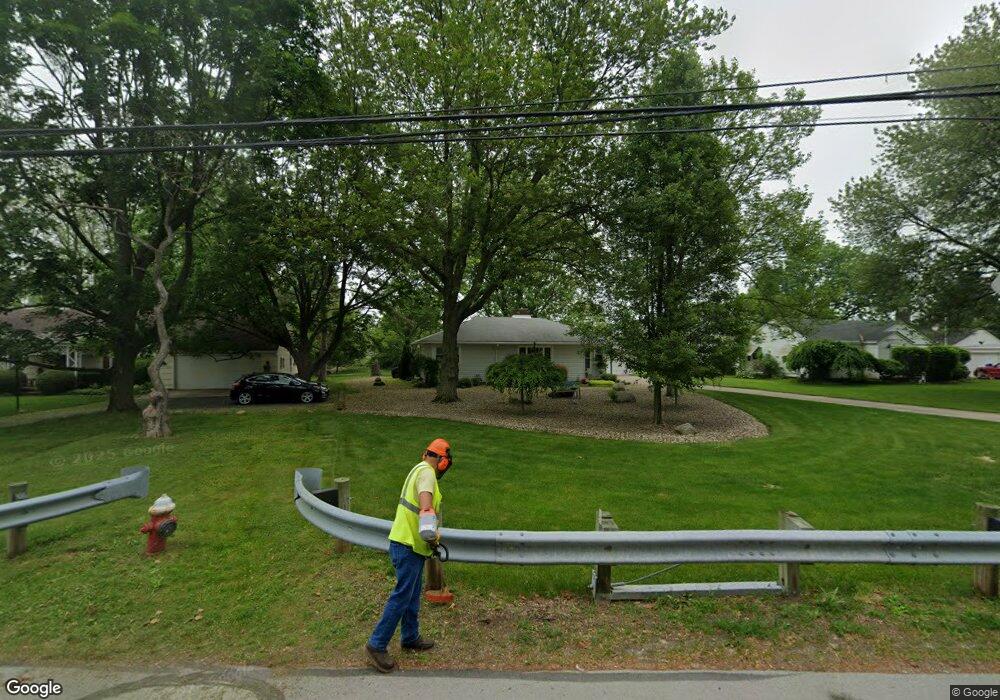
919 N Main St Amherst, OH 44001
Estimated Value: $227,903 - $272,000
2
Beds
2
Baths
1,359
Sq Ft
$180/Sq Ft
Est. Value
About This Home
This home is located at 919 N Main St, Amherst, OH 44001 and is currently estimated at $245,226, approximately $180 per square foot. 919 N Main St is a home located in Lorain County with nearby schools including Powers Elementary School, Walter G. Nord Middle School, and Amherst Junior High School.
Ownership History
Date
Name
Owned For
Owner Type
Purchase Details
Closed on
Dec 11, 2020
Sold by
Loescher Ronald E
Bought by
Loescher Ronald E and Loescher Matthew F
Current Estimated Value
Purchase Details
Closed on
Jan 5, 2012
Sold by
Colon Sherri
Bought by
Loescher Robert E
Home Financials for this Owner
Home Financials are based on the most recent Mortgage that was taken out on this home.
Original Mortgage
$112,000
Outstanding Balance
$76,784
Interest Rate
3.98%
Mortgage Type
VA
Estimated Equity
$168,442
Purchase Details
Closed on
Jul 26, 2002
Sold by
Robert Beesing and Beesing Robert G
Bought by
Beesing Robert G and Beesing Aletta B
Create a Home Valuation Report for This Property
The Home Valuation Report is an in-depth analysis detailing your home's value as well as a comparison with similar homes in the area
Home Values in the Area
Average Home Value in this Area
Purchase History
| Date | Buyer | Sale Price | Title Company |
|---|---|---|---|
| Loescher Ronald E | -- | None Available | |
| Loescher Robert E | $112,000 | Multiple | |
| Beesing Robert G | -- | -- |
Source: Public Records
Mortgage History
| Date | Status | Borrower | Loan Amount |
|---|---|---|---|
| Open | Loescher Robert E | $112,000 |
Source: Public Records
Tax History Compared to Growth
Tax History
| Year | Tax Paid | Tax Assessment Tax Assessment Total Assessment is a certain percentage of the fair market value that is determined by local assessors to be the total taxable value of land and additions on the property. | Land | Improvement |
|---|---|---|---|---|
| 2024 | $1,895 | $66,532 | $21,319 | $45,213 |
| 2023 | $1,633 | $52,392 | $15,957 | $36,435 |
| 2022 | $1,603 | $52,392 | $15,957 | $36,435 |
| 2021 | $1,607 | $52,392 | $15,957 | $36,435 |
| 2020 | $1,458 | $45,600 | $13,890 | $31,710 |
| 2019 | $1,429 | $45,600 | $13,890 | $31,710 |
| 2018 | $1,379 | $45,600 | $13,890 | $31,710 |
| 2017 | $1,322 | $41,790 | $12,220 | $29,570 |
| 2016 | $1,333 | $41,790 | $12,220 | $29,570 |
| 2015 | $1,326 | $41,790 | $12,220 | $29,570 |
| 2014 | $1,182 | $39,060 | $11,420 | $27,640 |
| 2013 | $1,667 | $39,060 | $11,420 | $27,640 |
Source: Public Records
Map
Nearby Homes
- 1011 N Main St
- 117 Fall Lake Ln
- 0 Cooper Foster Park Rd Unit 5129838
- 47020 Cooper Foster Park Rd
- 320 Pebble Creek Ct
- 357 Pebble Creek Ct
- 707 Greenlawn Dr
- 1250 N Main St
- 369 Pebble Creek Ct
- 110 Habant Dr
- 1280 Meadowview Ln
- 922 Sharondale Dr
- 3489 Coopers Trail
- 726 Sunrise Dr
- 0 Rosecliff Dr
- 483 N Main St
- Lehigh Plan at Sandy Springs Trail
- Columbia Plan at Sandy Springs Trail
- Bramante Ranch Plan at Sandy Springs Trail
- Alberti Ranch Plan at Sandy Springs Trail
- 921 N Main St
- 917 N Main St
- 913 N Main St
- 927 N Main St
- 909 N Main St
- 1001 N Main St
- 131 Springvale Dr
- 125 Lakeview Cir
- 127 Lakeview Cir
- 133 Springvale Dr
- 905 N Main St
- 135 Springvale Dr
- 129 Springvale Dr
- 370 Quarry Lakes Dr
- 380 Quarry Lakes Dr
- 137 Springvale Dr
- 40 Springvale Dr
- 40 S/L Springvale Dr
- 31 Springvale Dr
- 126 Lakeview Cir