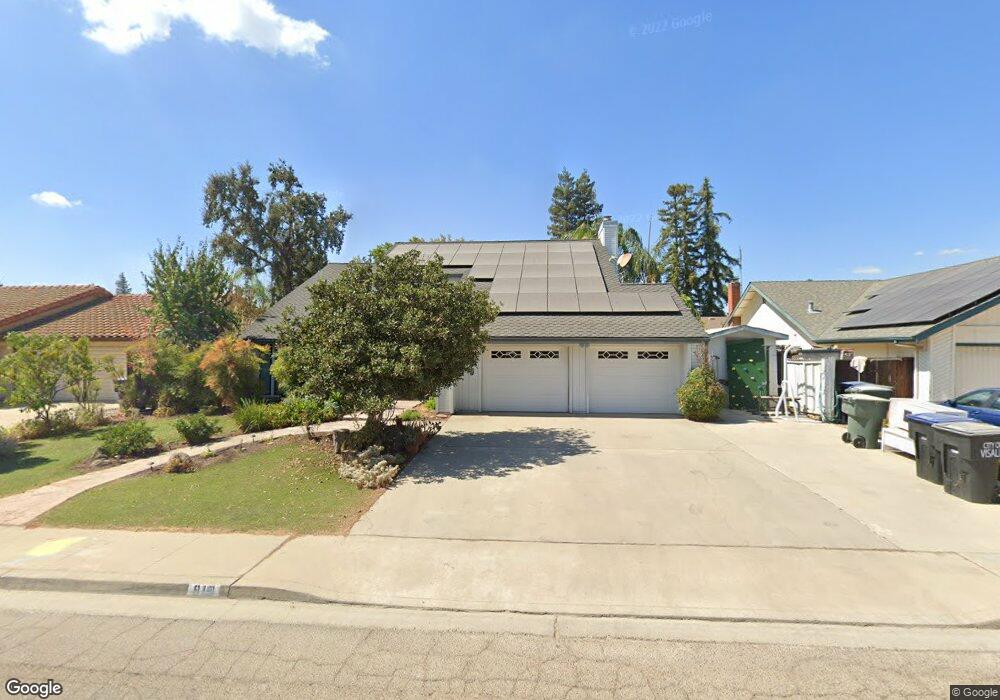
919 N Rono St Visalia, CA 93291
Northwest Visalia NeighborhoodEstimated Value: $449,000 - $480,096
3
Beds
3
Baths
2,100
Sq Ft
$222/Sq Ft
Est. Value
About This Home
This home is located at 919 N Rono St, Visalia, CA 93291 and is currently estimated at $465,524, approximately $221 per square foot. 919 N Rono St is a home located in Tulare County with nearby schools including Willow Glen Elementary, Green Acres Middle School, and Redwood High School.
Ownership History
Date
Name
Owned For
Owner Type
Purchase Details
Closed on
Mar 1, 2022
Sold by
Riley Michael E and Riley Celeste K
Bought by
Rivera Alvaro
Current Estimated Value
Home Financials for this Owner
Home Financials are based on the most recent Mortgage that was taken out on this home.
Original Mortgage
$373,117
Outstanding Balance
$348,494
Interest Rate
3.89%
Mortgage Type
FHA
Estimated Equity
$117,030
Purchase Details
Closed on
Oct 25, 1999
Sold by
Federal Home Loan Mortgage Corporation
Bought by
Riley Michael E and Riley Celeste K
Home Financials for this Owner
Home Financials are based on the most recent Mortgage that was taken out on this home.
Original Mortgage
$83,000
Interest Rate
7.82%
Purchase Details
Closed on
Apr 12, 1999
Sold by
Kennedy Steven R and Kennedy Vanda L
Bought by
Federal Home Loan Mortgage Corporation
Purchase Details
Closed on
Oct 20, 1993
Sold by
Delrio Dennis A
Bought by
Kennedy Steven R and Kennedy Vanda L
Home Financials for this Owner
Home Financials are based on the most recent Mortgage that was taken out on this home.
Original Mortgage
$138,600
Interest Rate
7.09%
Create a Home Valuation Report for This Property
The Home Valuation Report is an in-depth analysis detailing your home's value as well as a comparison with similar homes in the area
Home Values in the Area
Average Home Value in this Area
Purchase History
| Date | Buyer | Sale Price | Title Company |
|---|---|---|---|
| Rivera Alvaro | $380,000 | Chicago Title | |
| Riley Michael E | $145,000 | Cuesta Title Company | |
| Federal Home Loan Mortgage Corporation | $132,000 | First American Title Ins Co | |
| Kennedy Steven R | $154,000 | Chicago Title Company |
Source: Public Records
Mortgage History
| Date | Status | Borrower | Loan Amount |
|---|---|---|---|
| Open | Rivera Alvaro | $373,117 | |
| Previous Owner | Riley Michael E | $83,000 | |
| Previous Owner | Kennedy Steven R | $138,600 |
Source: Public Records
Tax History Compared to Growth
Tax History
| Year | Tax Paid | Tax Assessment Tax Assessment Total Assessment is a certain percentage of the fair market value that is determined by local assessors to be the total taxable value of land and additions on the property. | Land | Improvement |
|---|---|---|---|---|
| 2025 | $4,399 | $403,258 | $100,814 | $302,444 |
| 2024 | $4,399 | $395,352 | $98,838 | $296,514 |
| 2023 | $4,248 | $387,600 | $96,900 | $290,700 |
| 2022 | $2,185 | $210,013 | $65,176 | $144,837 |
| 2021 | $2,188 | $205,895 | $63,898 | $141,997 |
| 2020 | $2,170 | $203,784 | $63,243 | $140,541 |
| 2019 | $2,107 | $199,788 | $62,003 | $137,785 |
| 2018 | $2,055 | $195,870 | $60,787 | $135,083 |
| 2017 | $2,033 | $192,029 | $59,595 | $132,434 |
| 2016 | $1,995 | $188,263 | $58,426 | $129,837 |
| 2015 | $1,938 | $185,435 | $57,548 | $127,887 |
| 2014 | $1,938 | $181,803 | $56,421 | $125,382 |
Source: Public Records
Map
Nearby Homes
- 1126 N Linwood St
- 1214 N Julieann Ct
- 3900 W Allen Ct
- 4140 W School Ave
- 145 E Taylor Ave
- 3438 N Oakwood Ct
- 3414 N Oakwood St
- 3432 N Atwood Ct
- 3728 W Nicholas Ave
- 350 N Crenshaw St
- 1007 N Atwood St
- 3727 W Mill Creek Dr
- 5010 W Oak Ave
- 4702 W Harold Ave
- 0000 Hyde Park Lot 4
- 4029 W Hillsdale Ct
- 3735 W Woodside Ave
- 4106 W Prospect Ave
- 3010 N Monarch St
- 3018 N Monarch St
- 931 N Rono St
- 909 N Rono St
- 1000 N Cindy St
- 4401 W Leighson Ave
- 943 N Rono St
- 4242 W Grove Ct
- 847 N Rono St
- 844 N Cindy Ct
- 1004 N Cindy St
- 825 N Cindy St
- 4407 W Leighson Ave
- 1005 N Rono St
- 4241 W Grove Ct
- 836 N Cindy Ct
- 835 N Rono St
- 4230 W Grove Ct
- 1008 N Cindy St
- 843 N Cindy Ct
- 834 N Rono St
- 4415 W Leighson Ave